Equity explanation image library
Every premium equity image created during this website build, collected in one clickable library. Open any image at full size.
Images grouped by the topic they explain
No random mixing: every visual is grouped with its subject, blue-theme equity images are excluded, and numbered series are kept in ascending order.
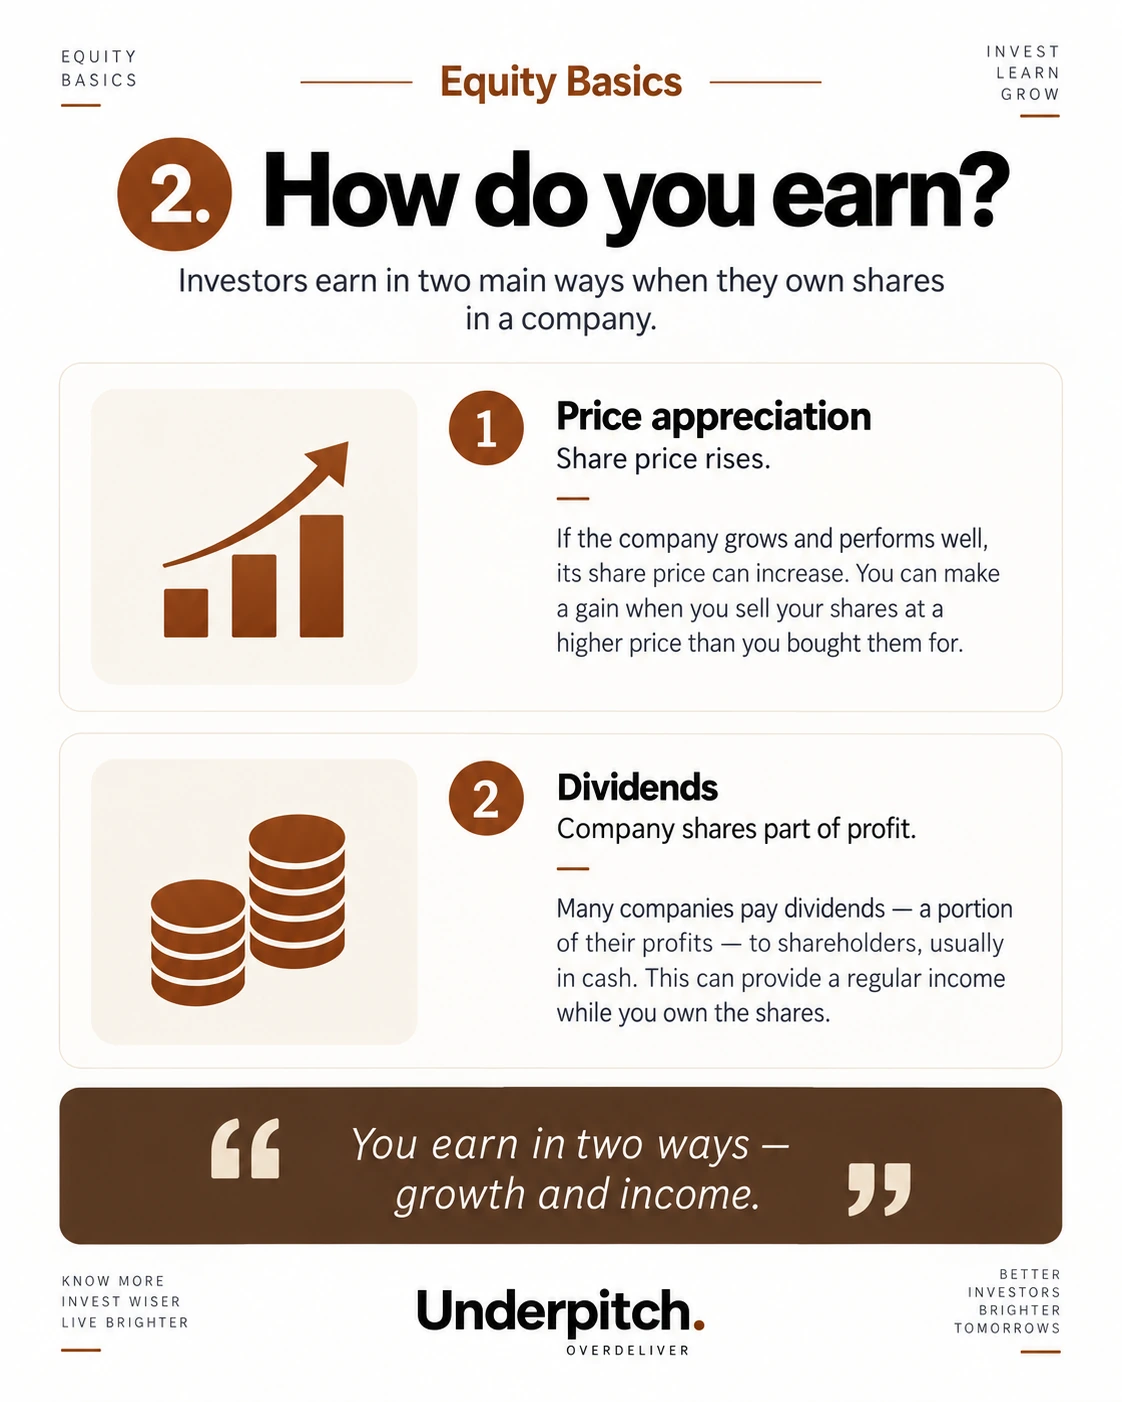
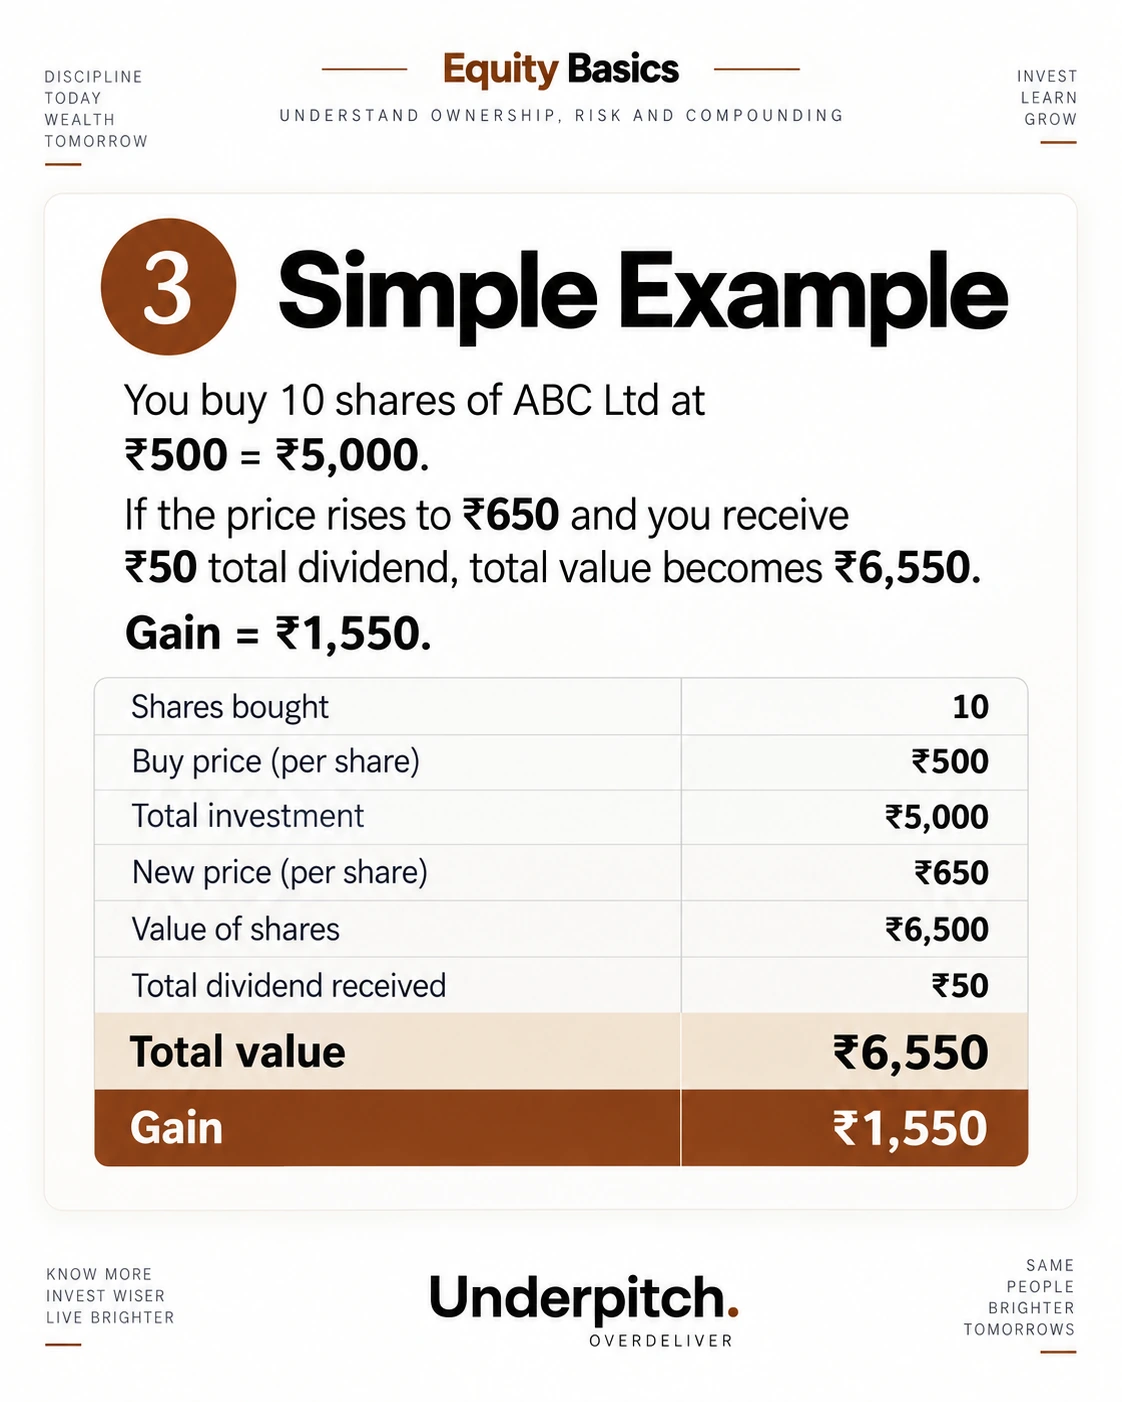
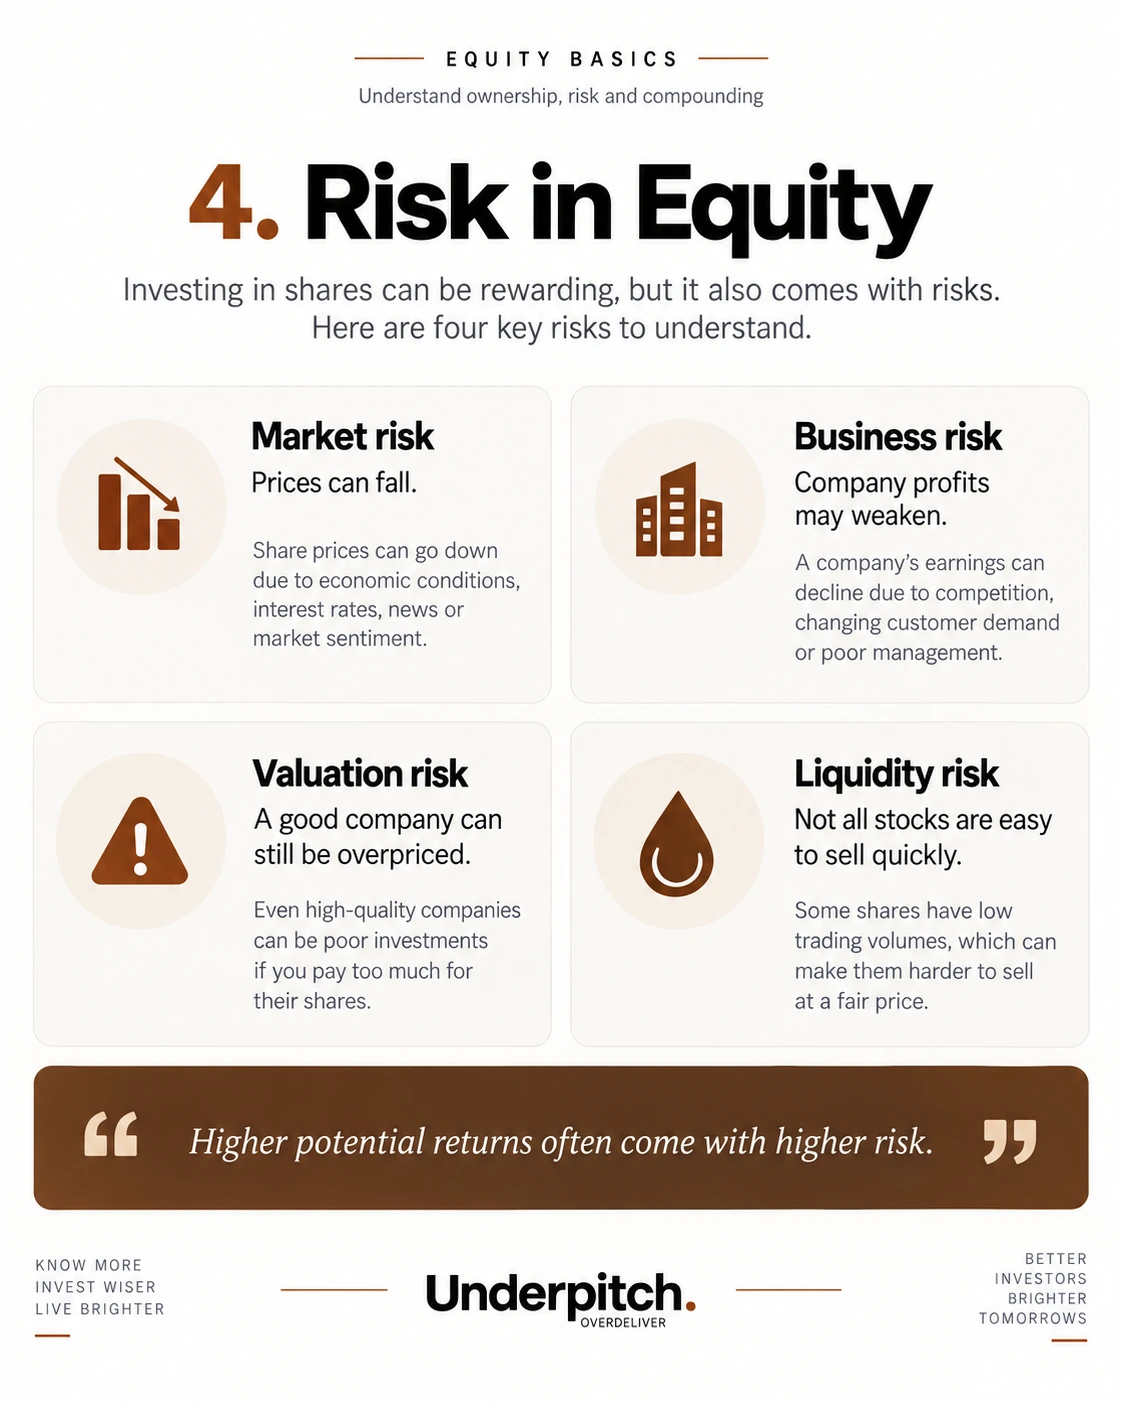
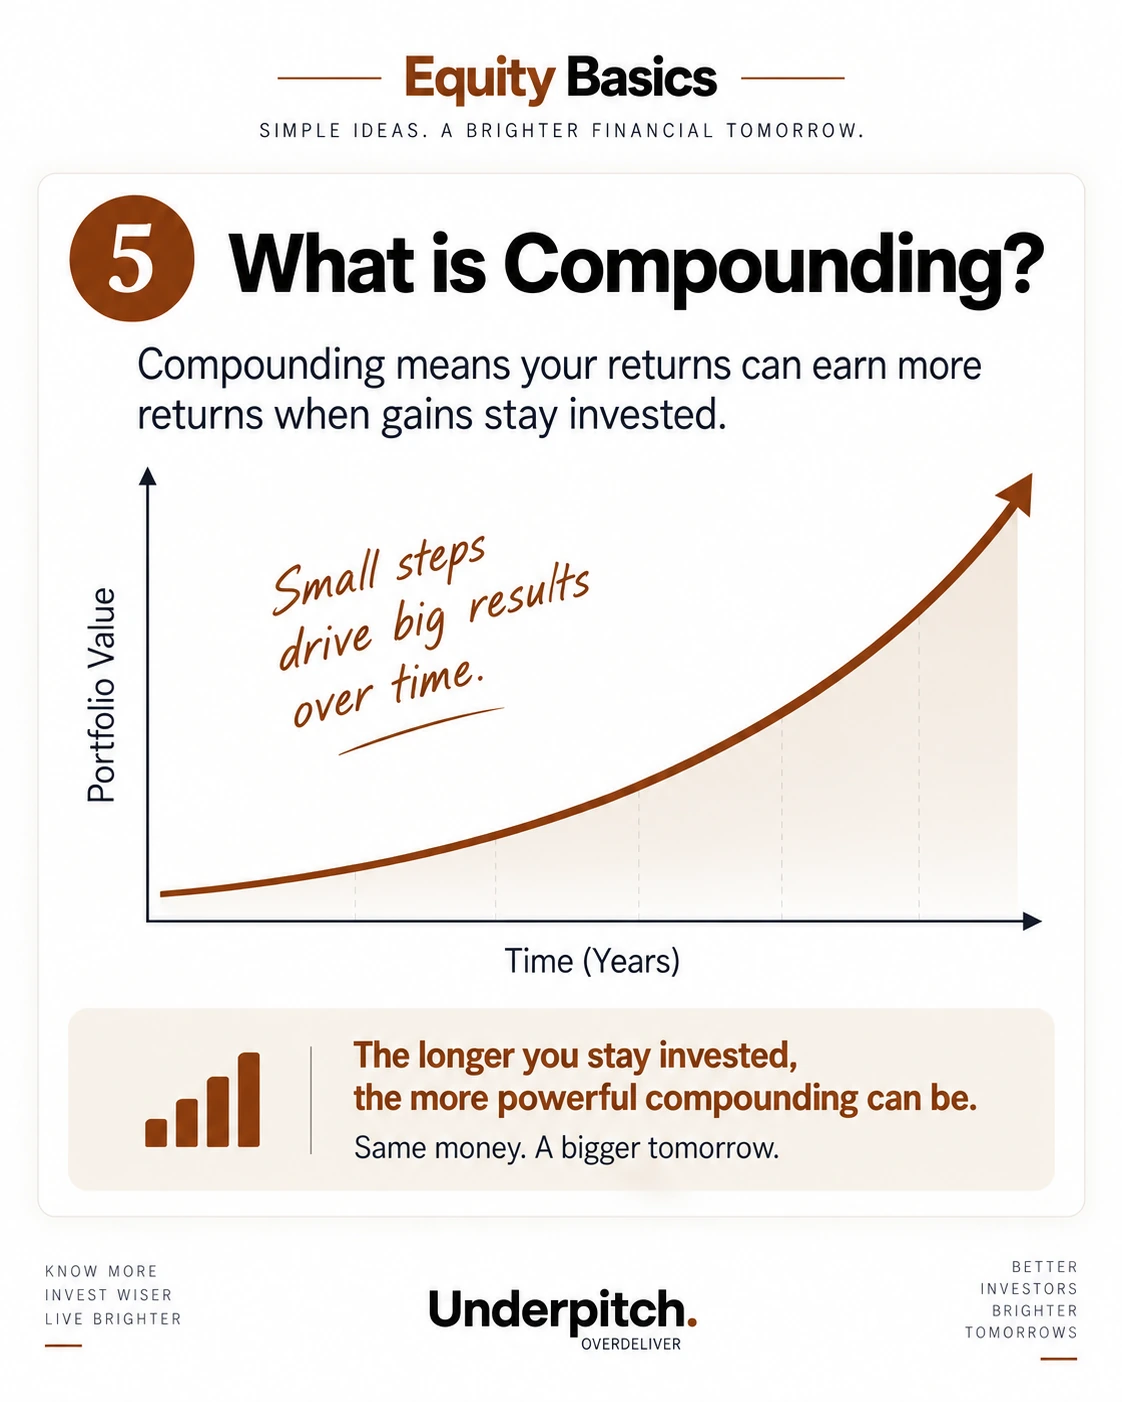
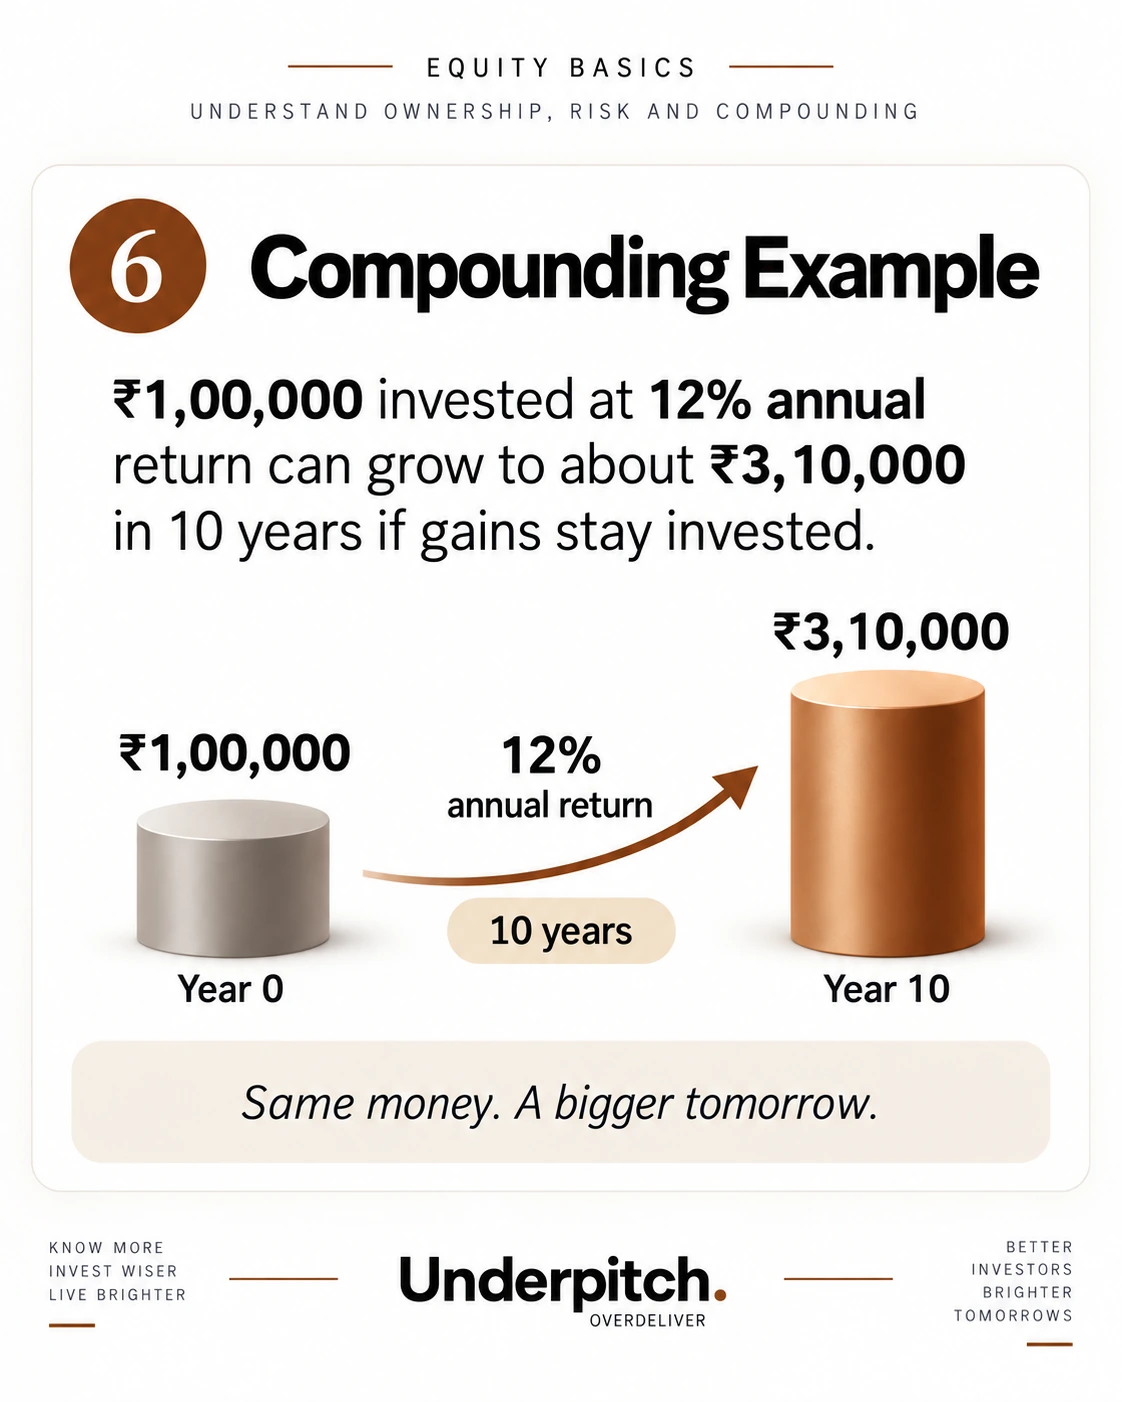
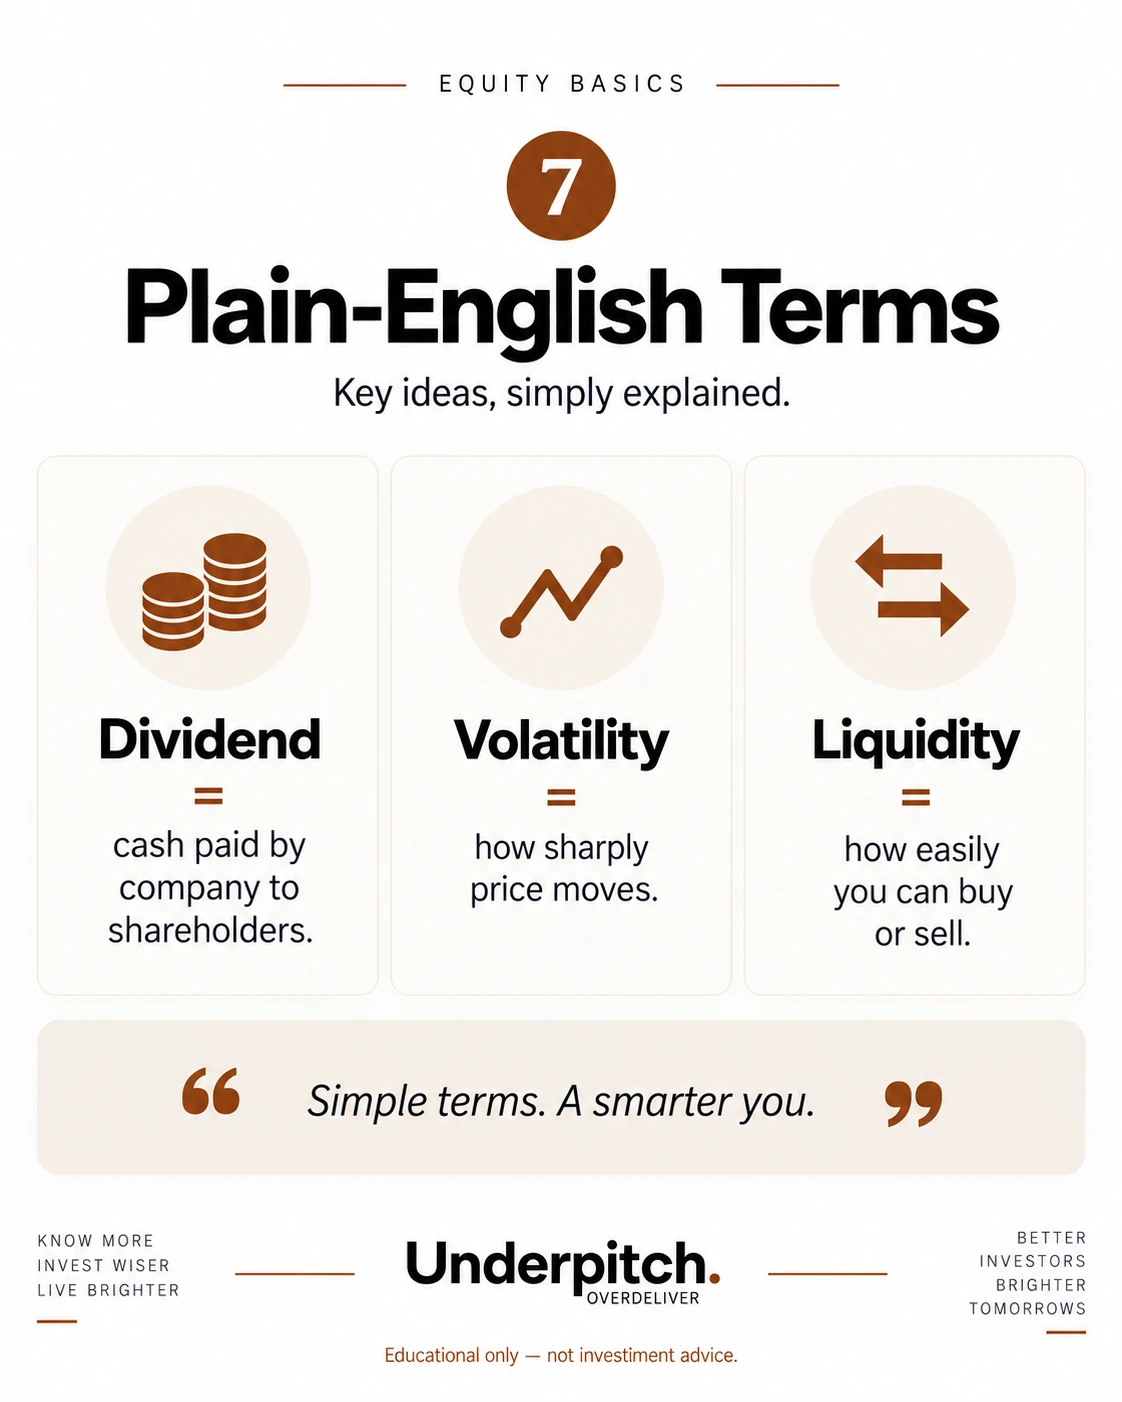
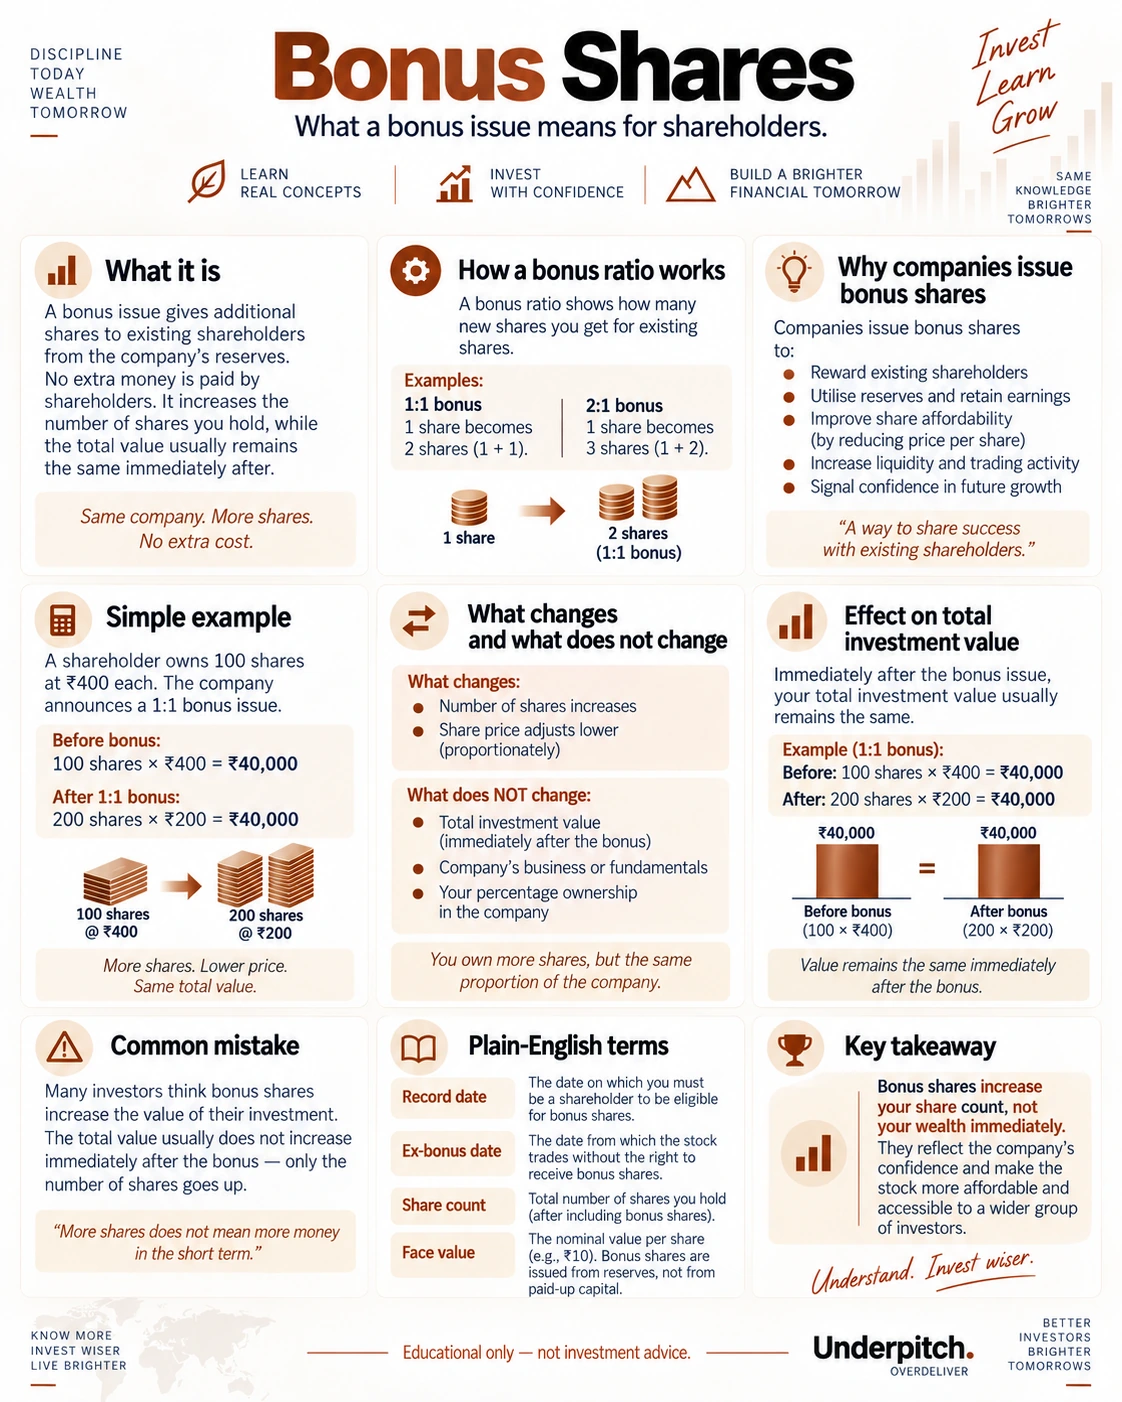
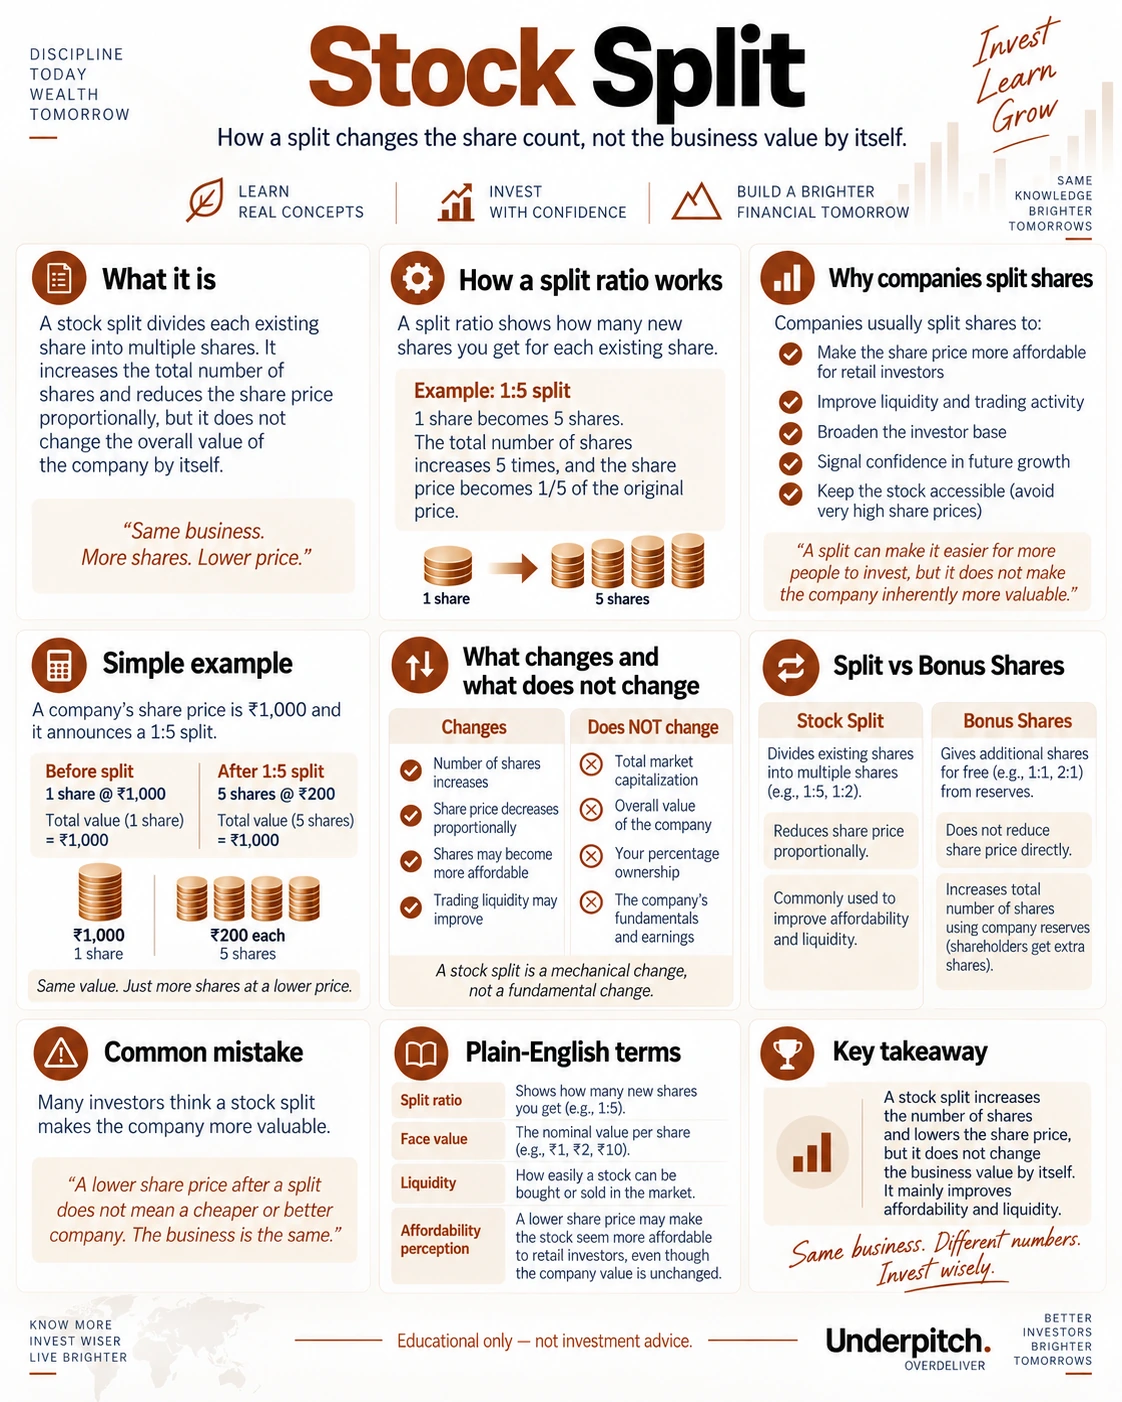
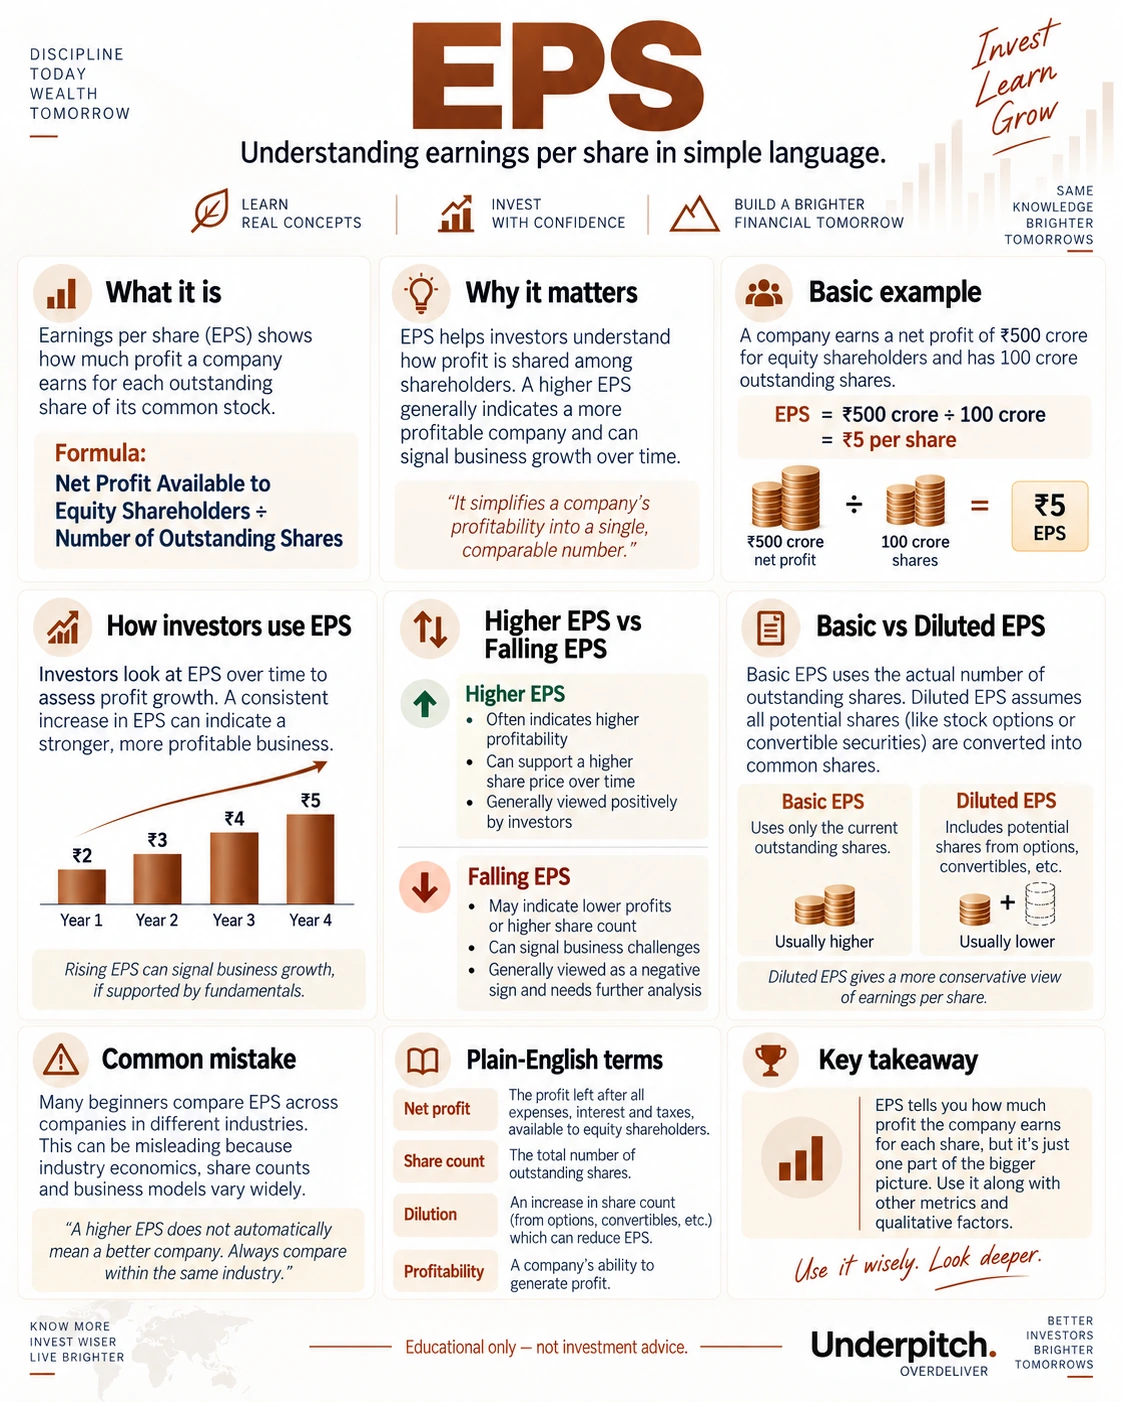
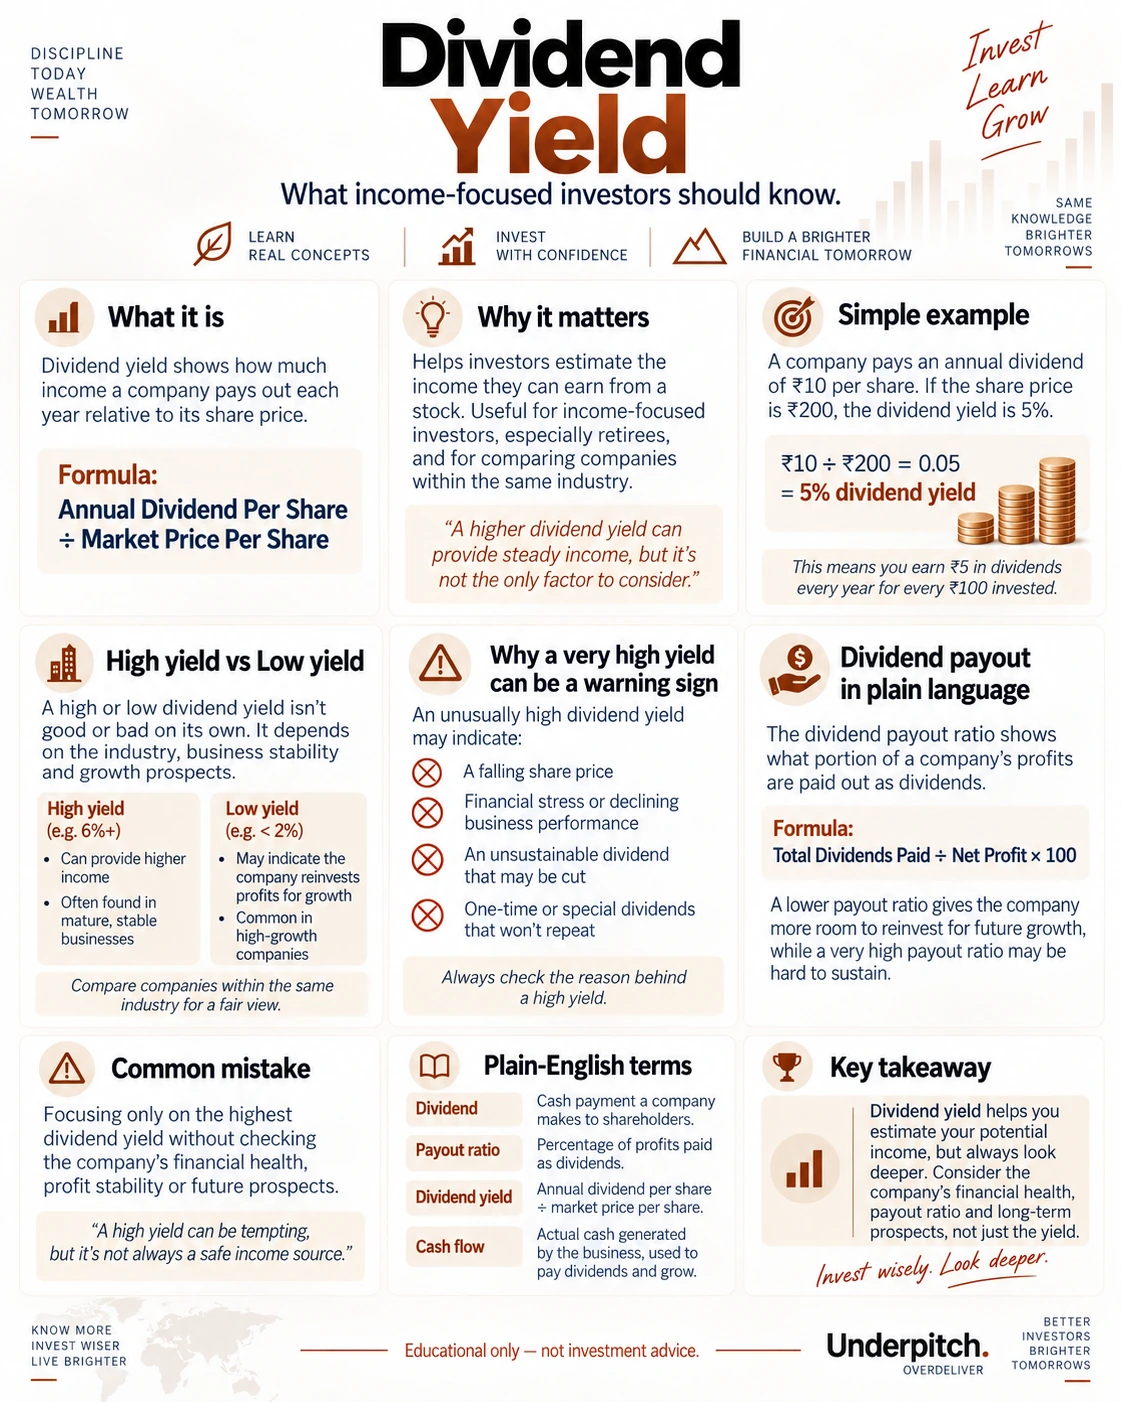
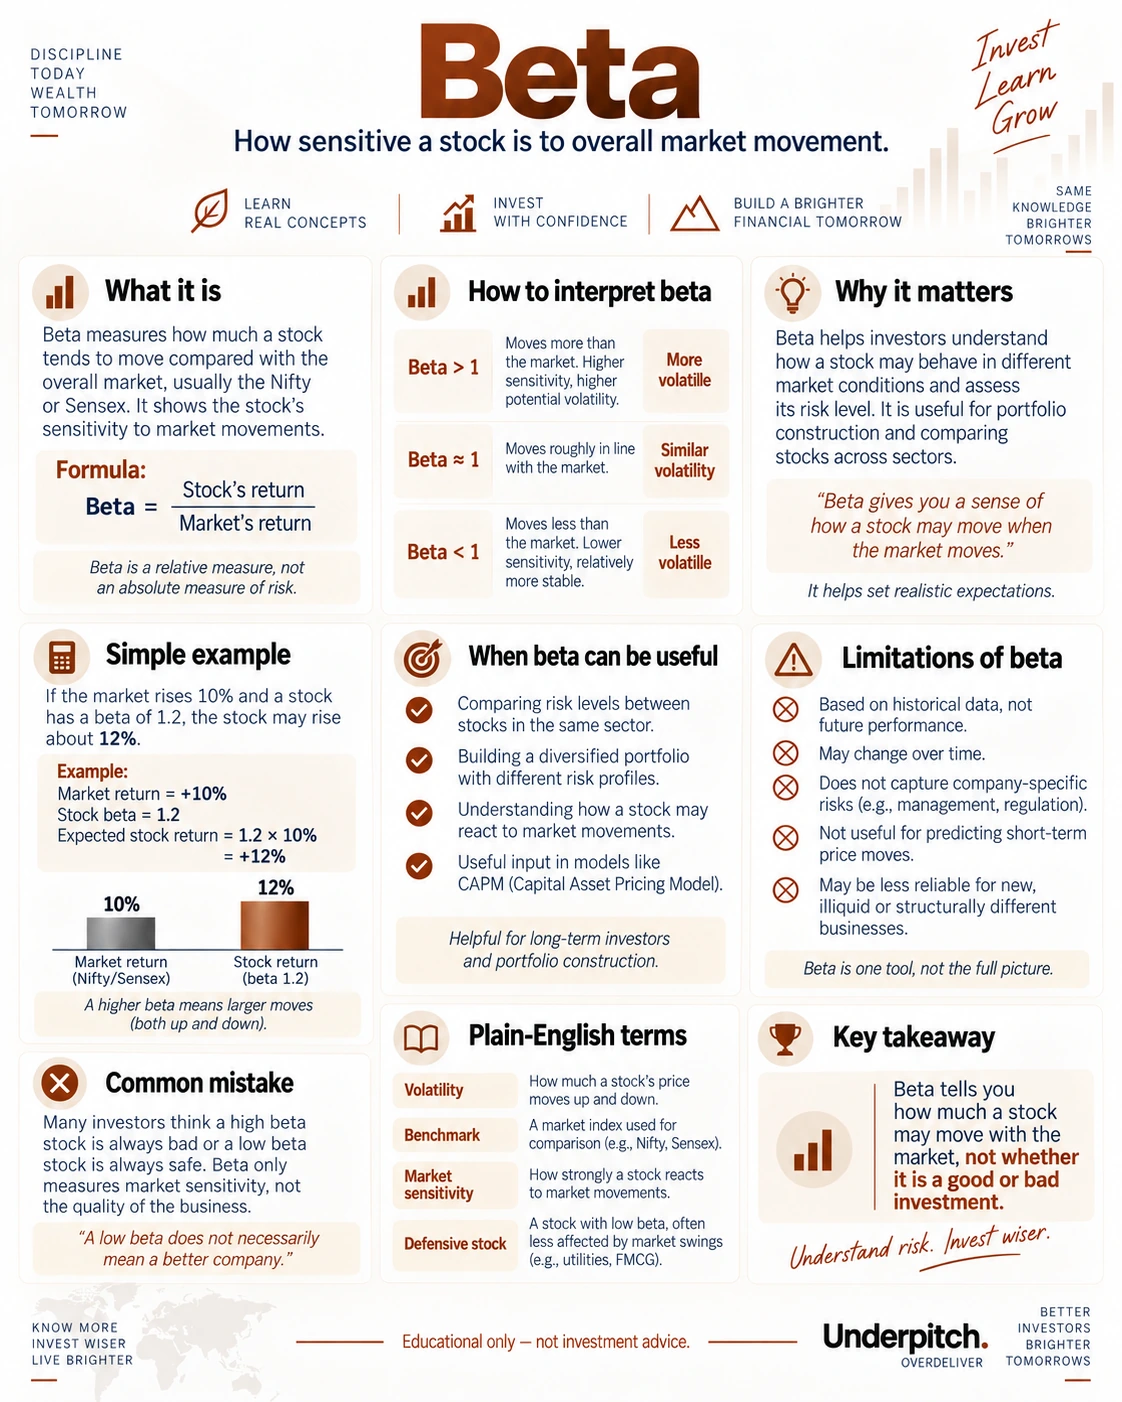
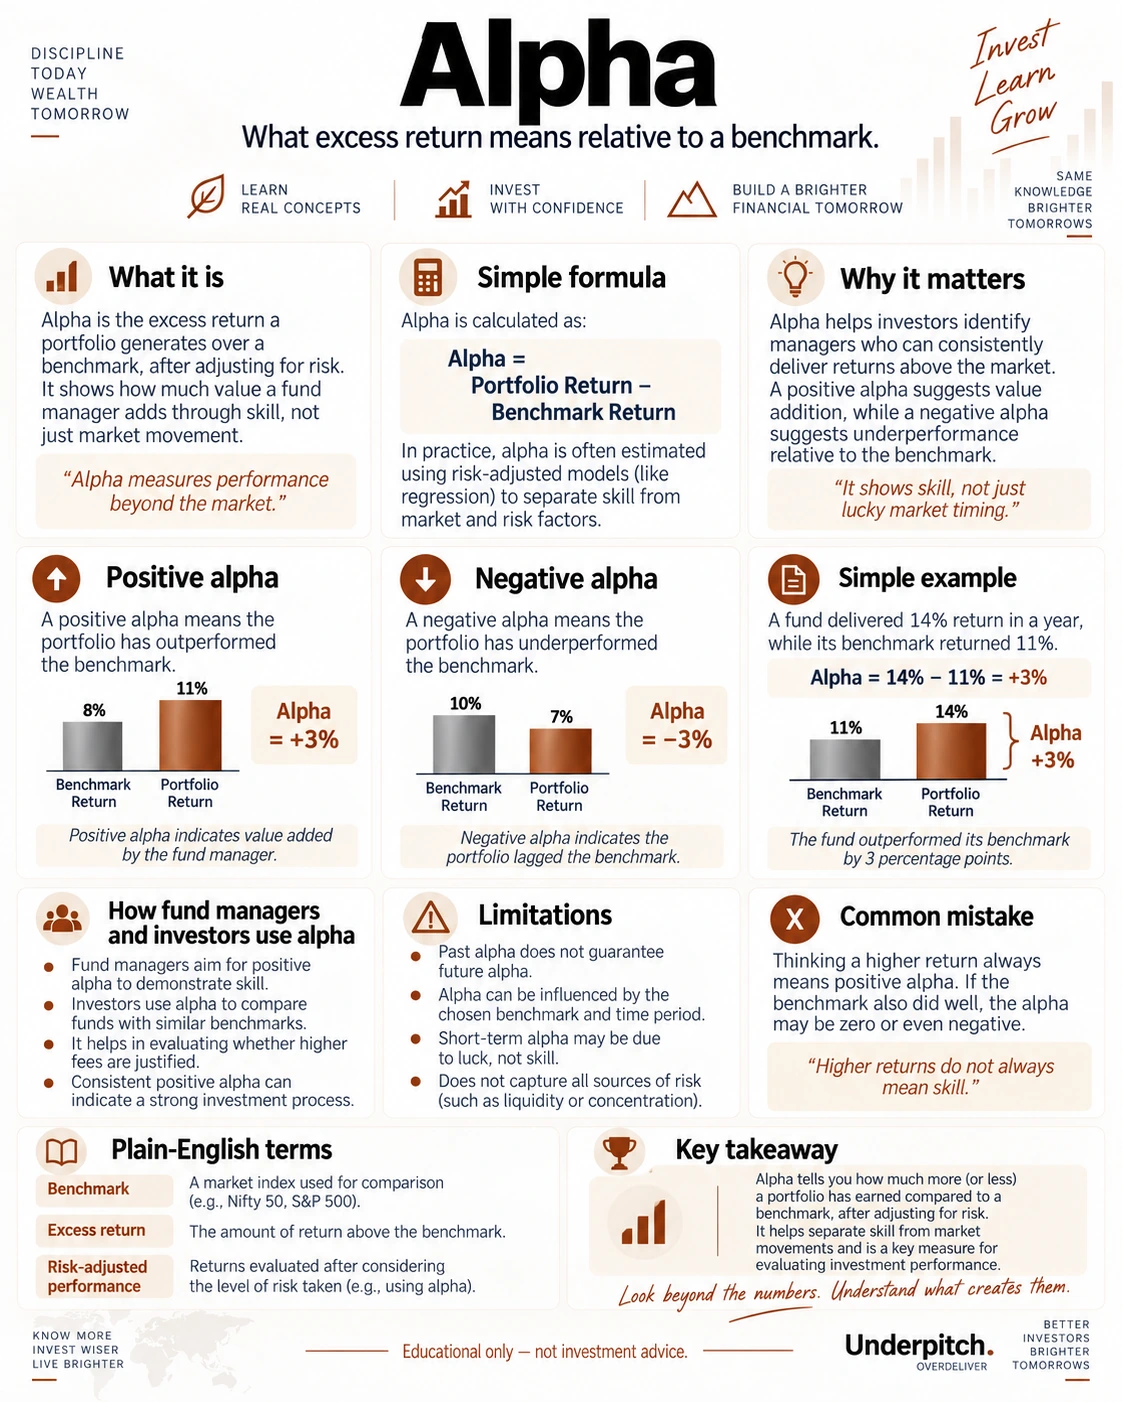
Equity basics
Follows the beginner learning sequence first, then corporate actions.

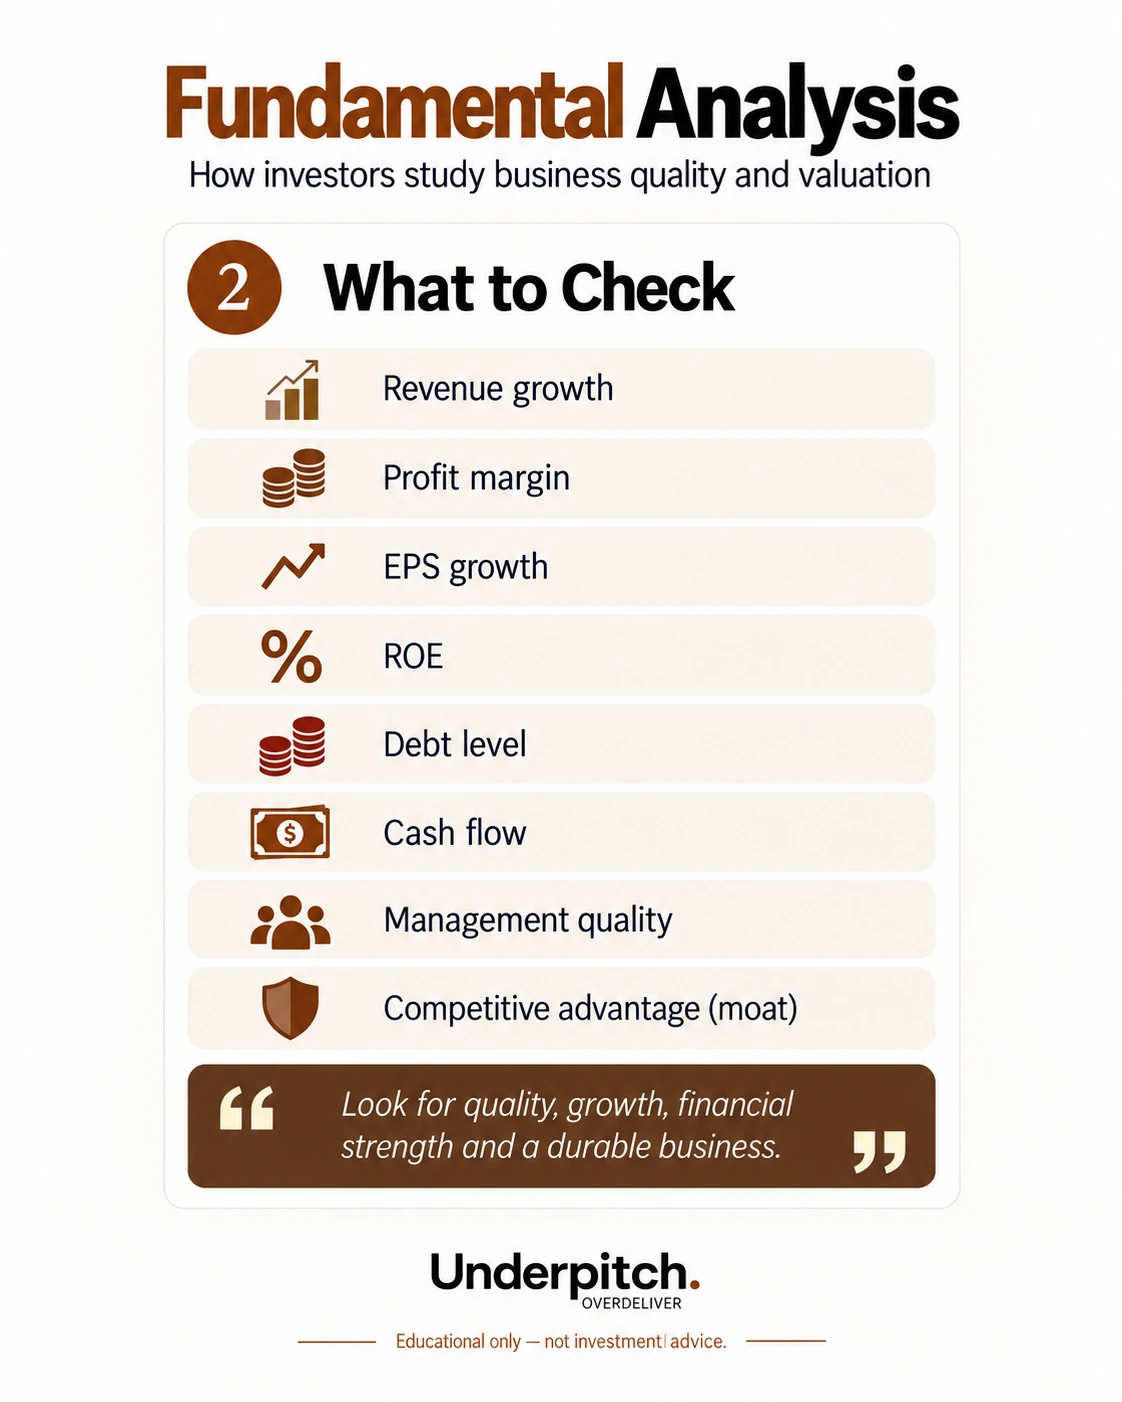
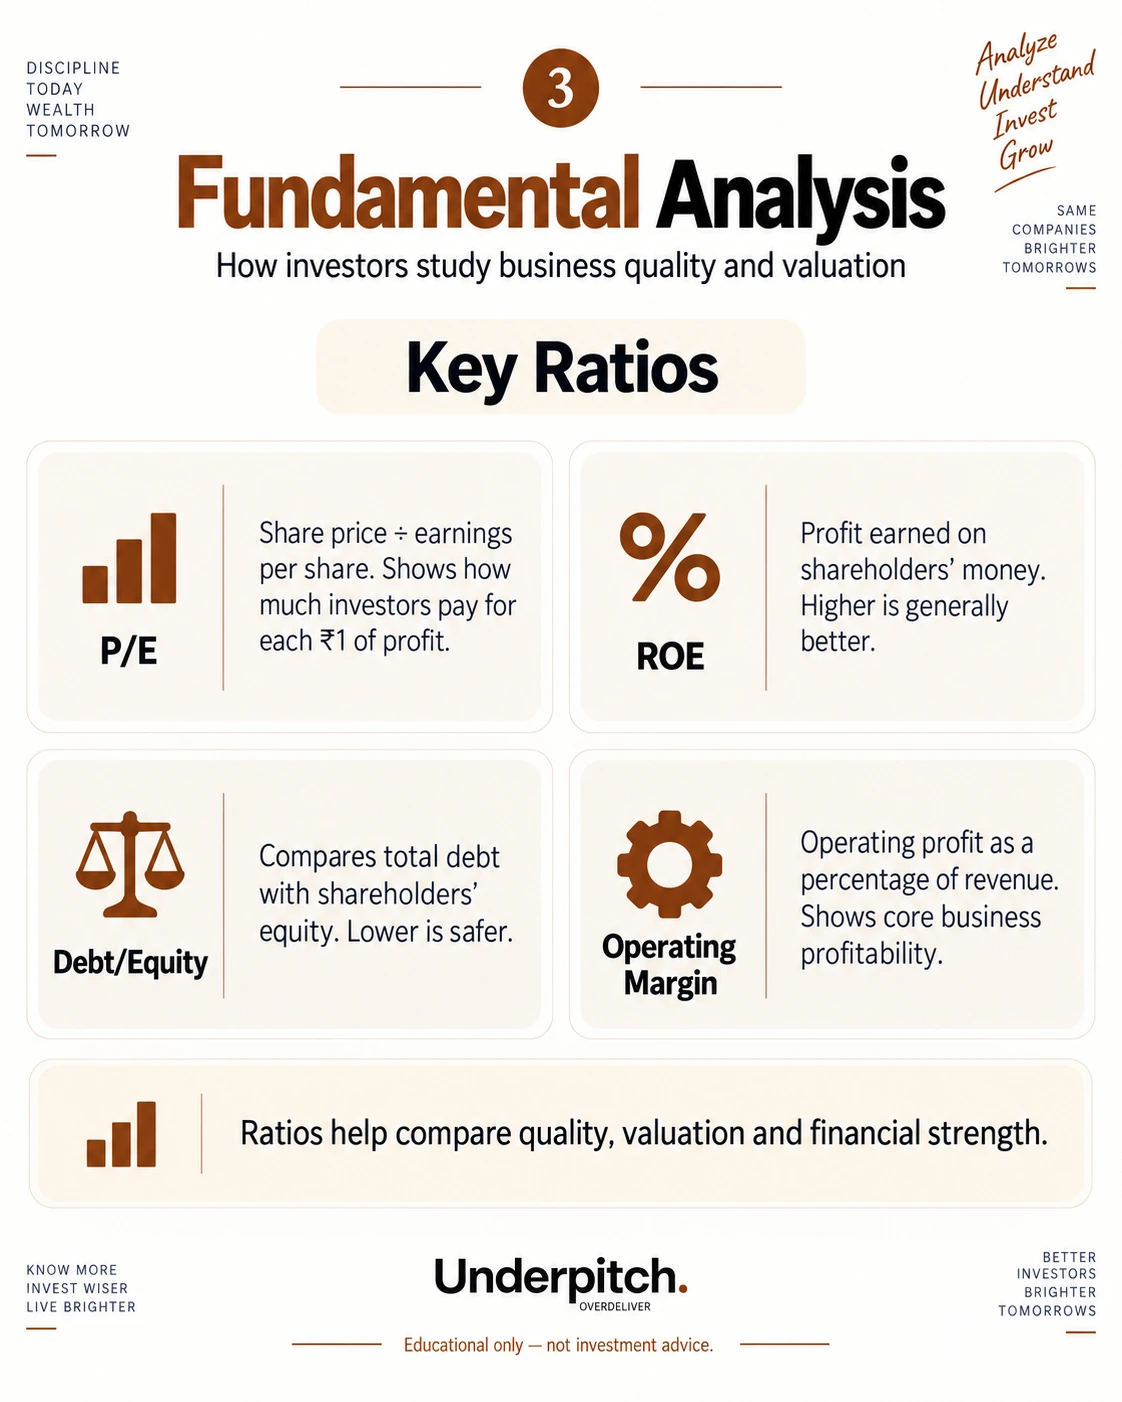
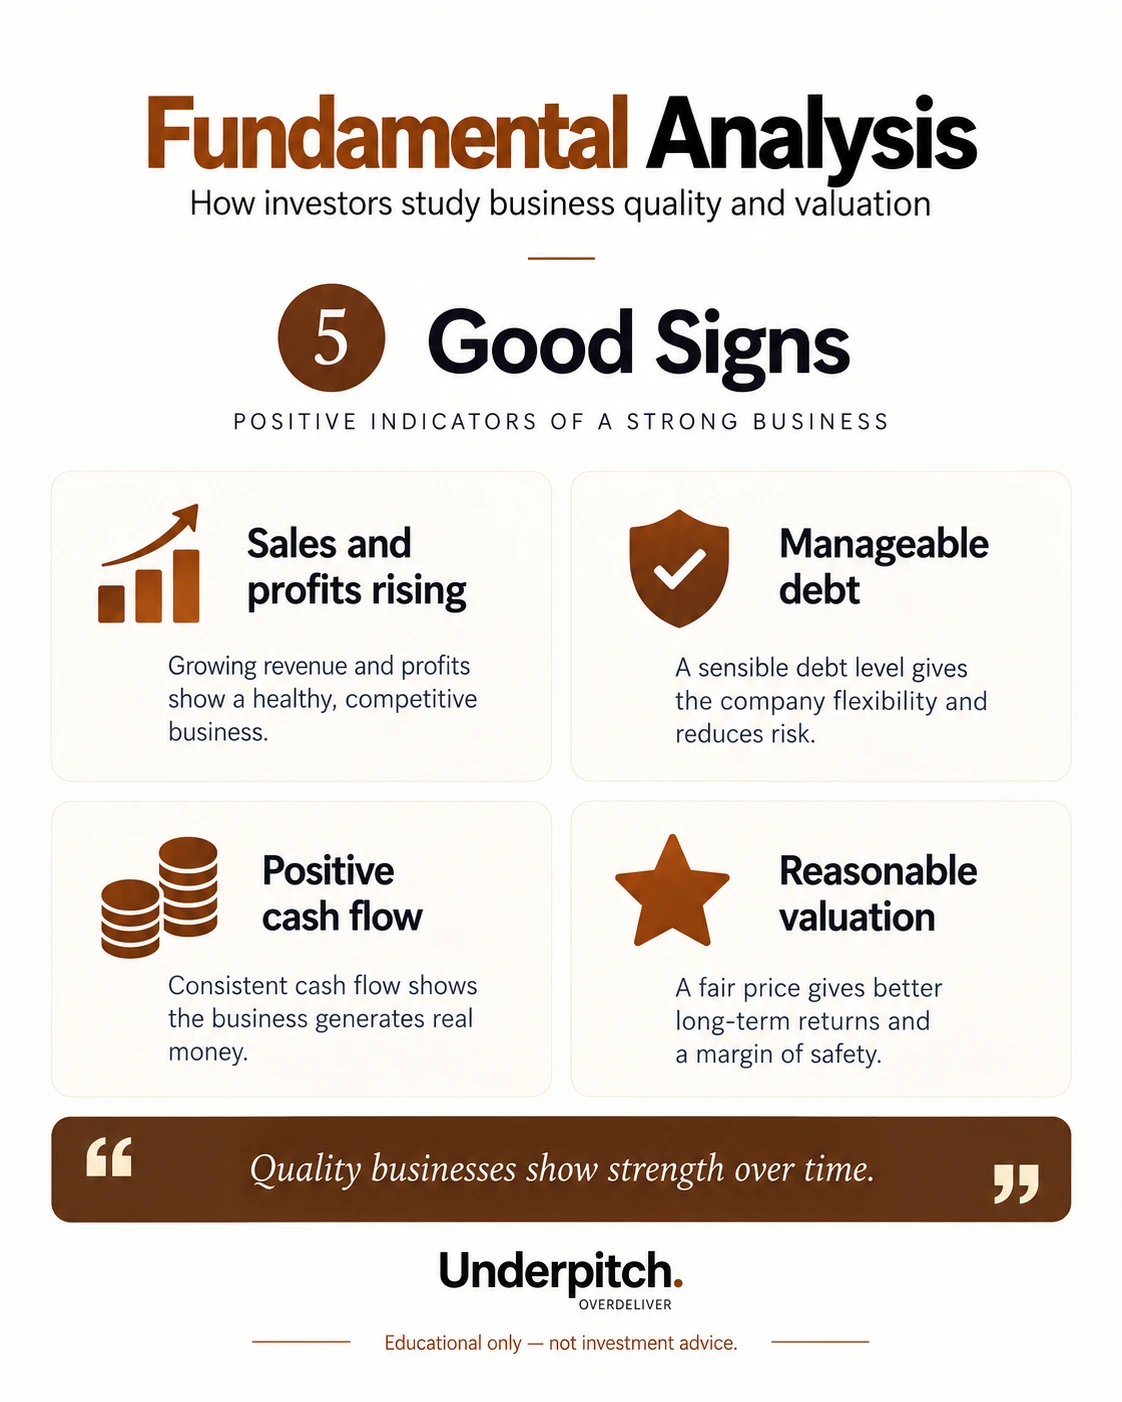
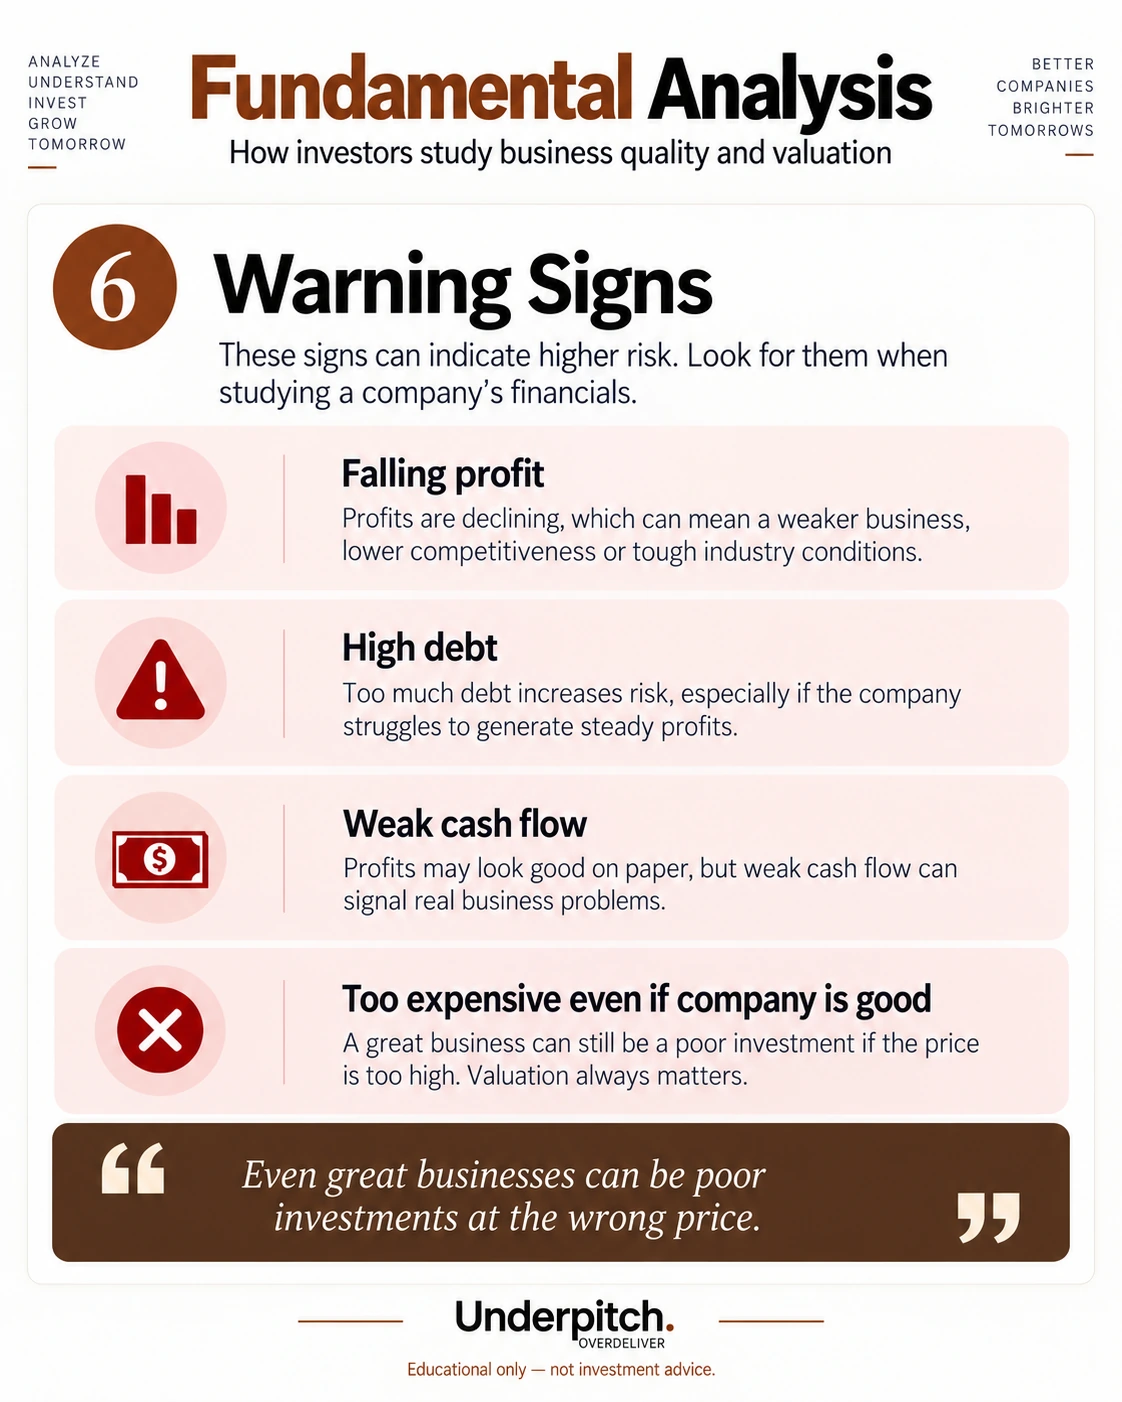
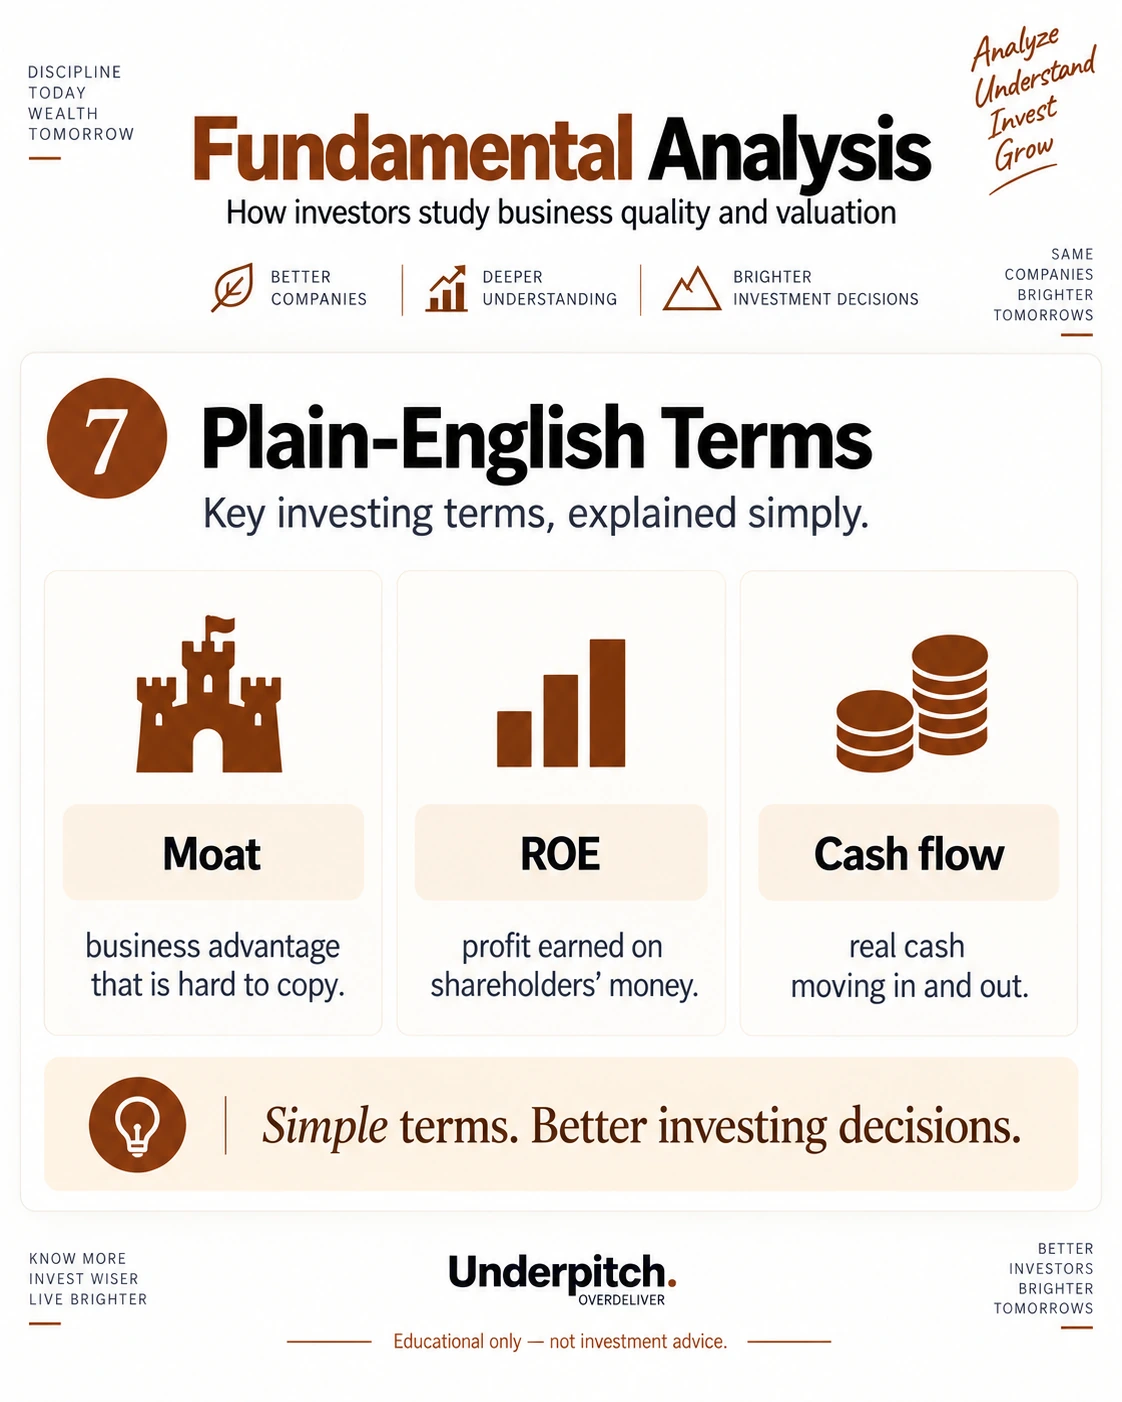
Fundamental analysis
Numbered visuals stay in ascending order; the removed blue overview is not used.
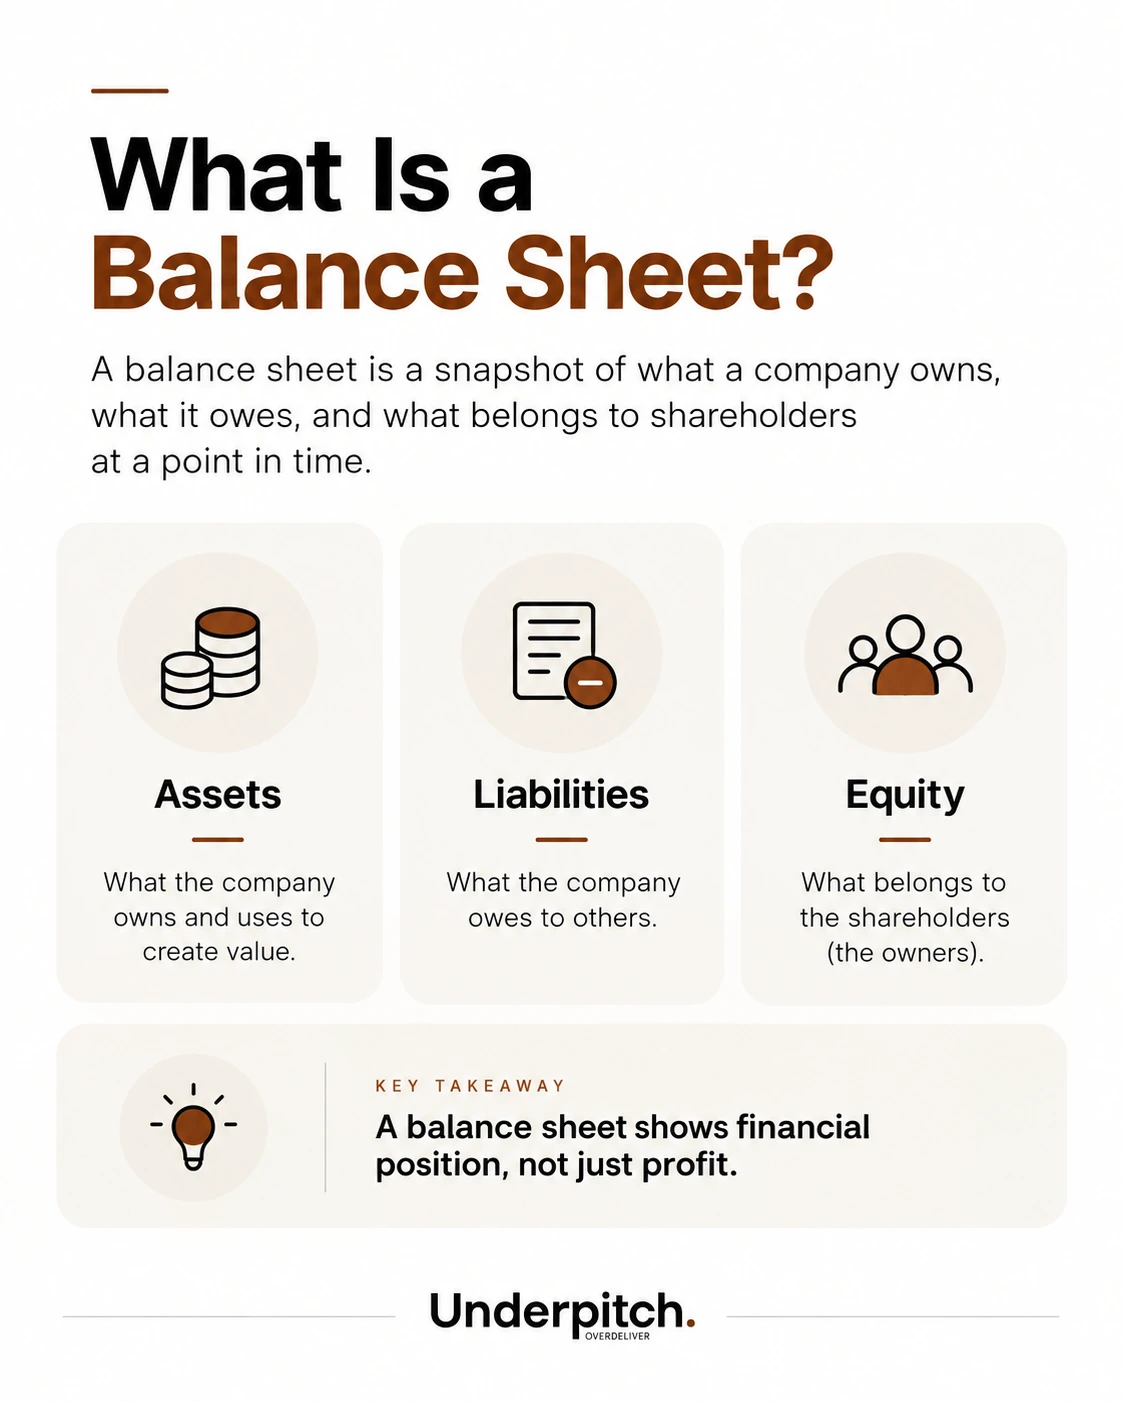
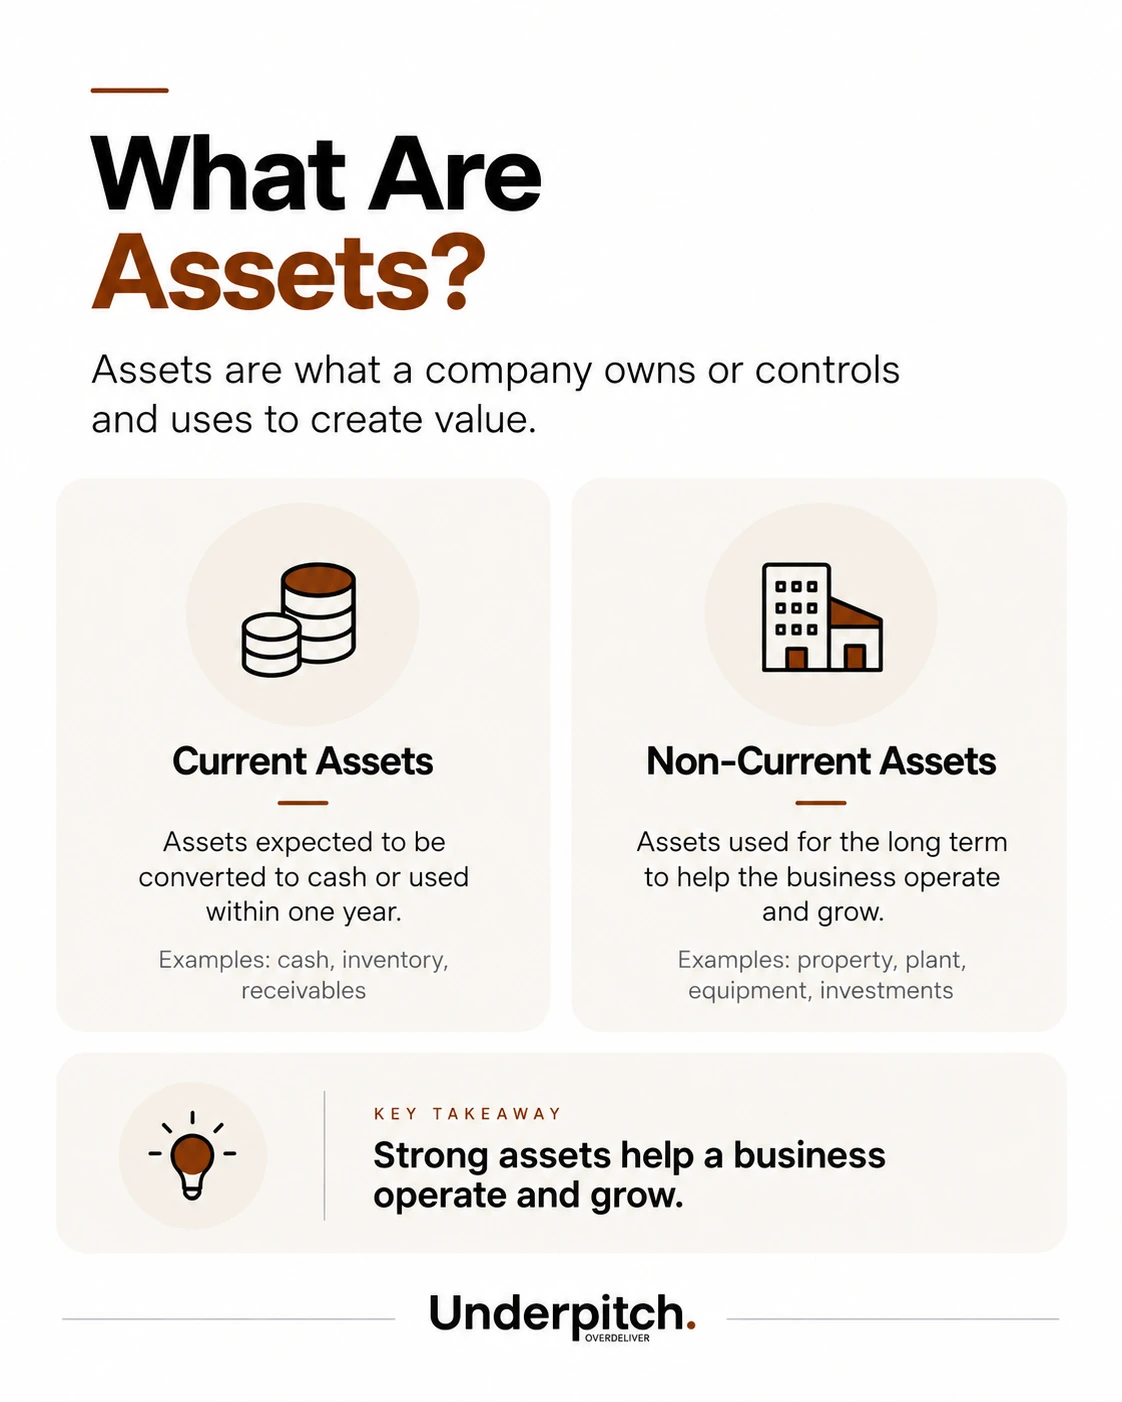
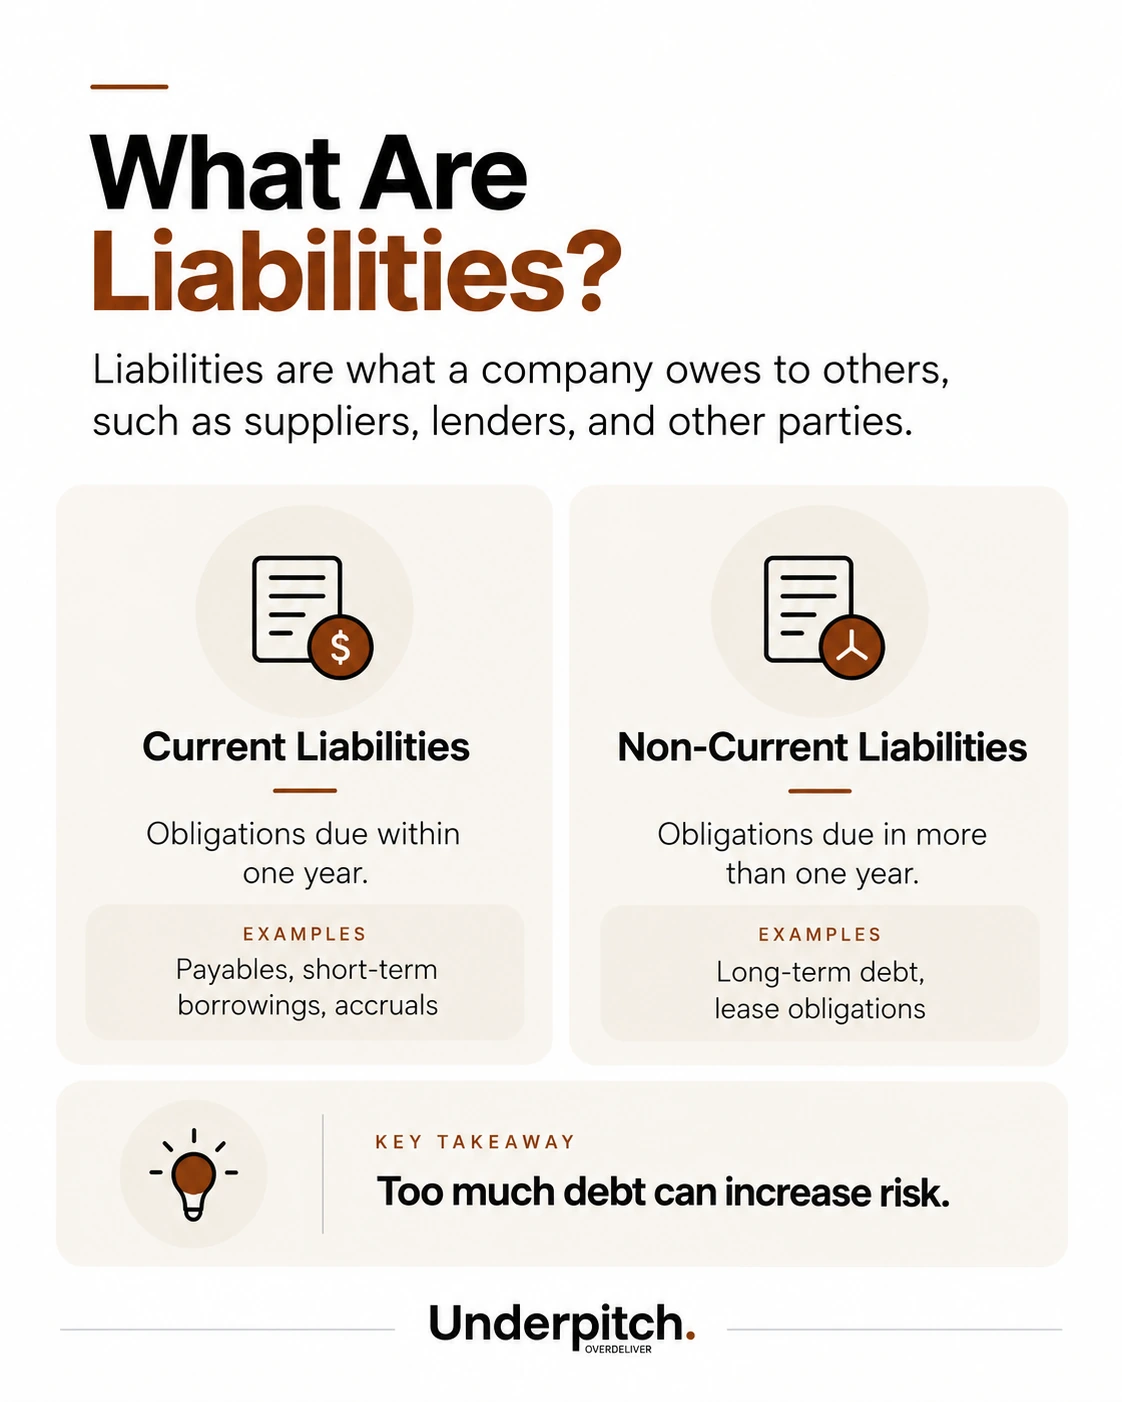
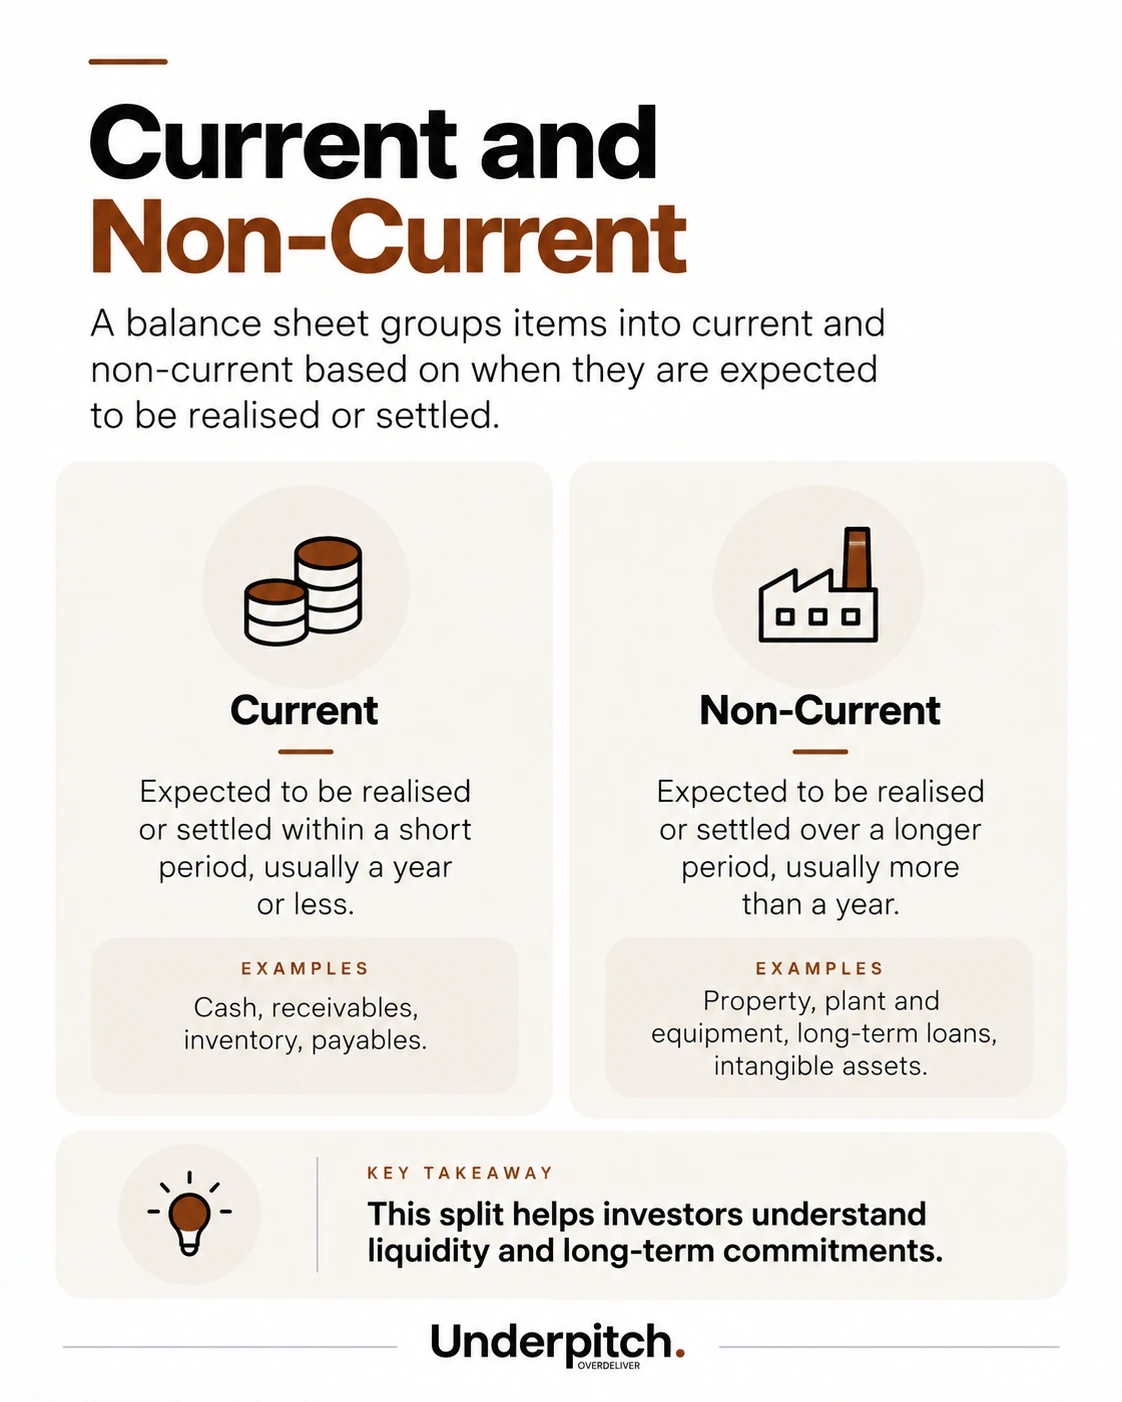
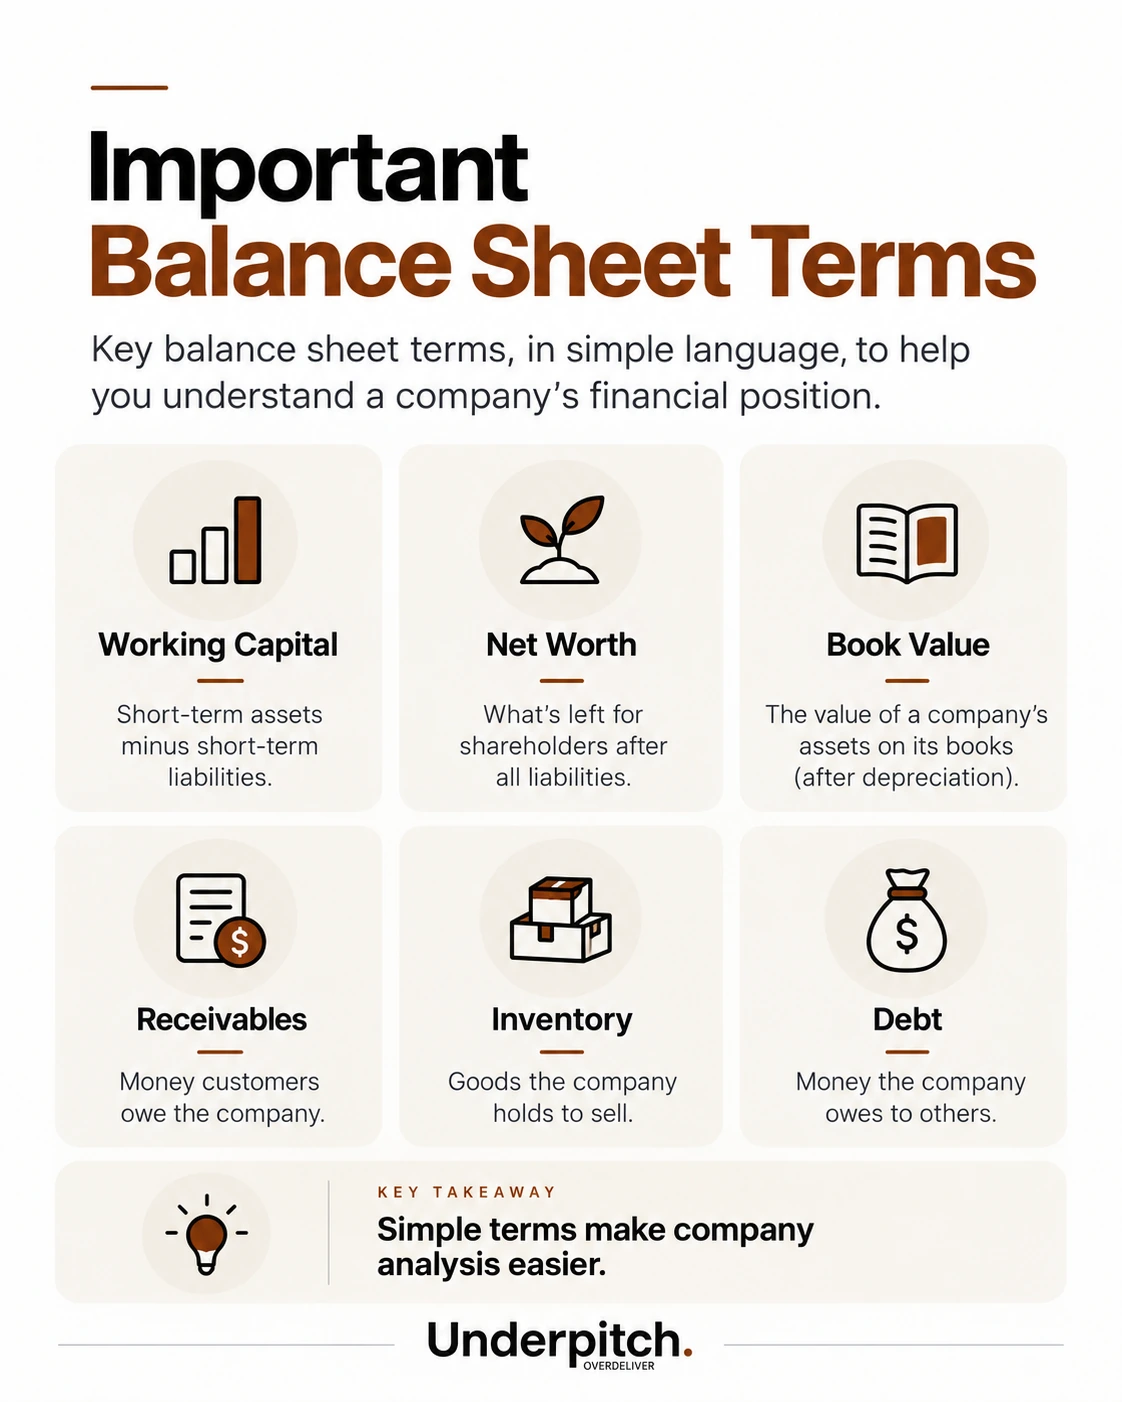
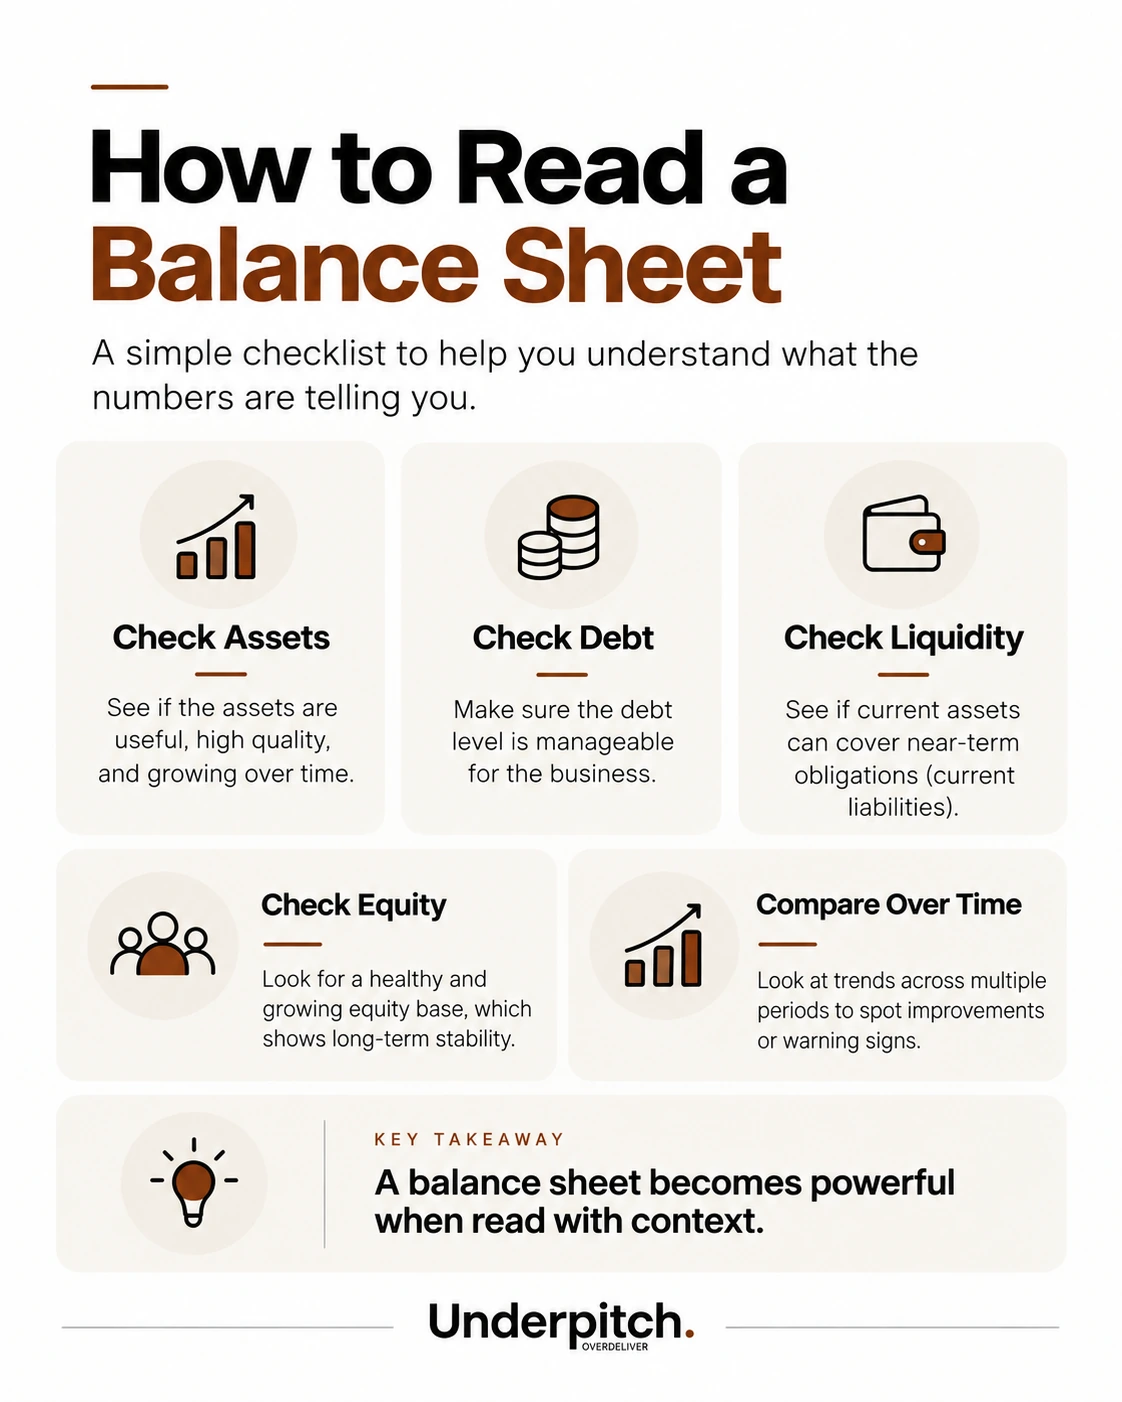
Balance sheet
Direct visuals for each balance-sheet concept.
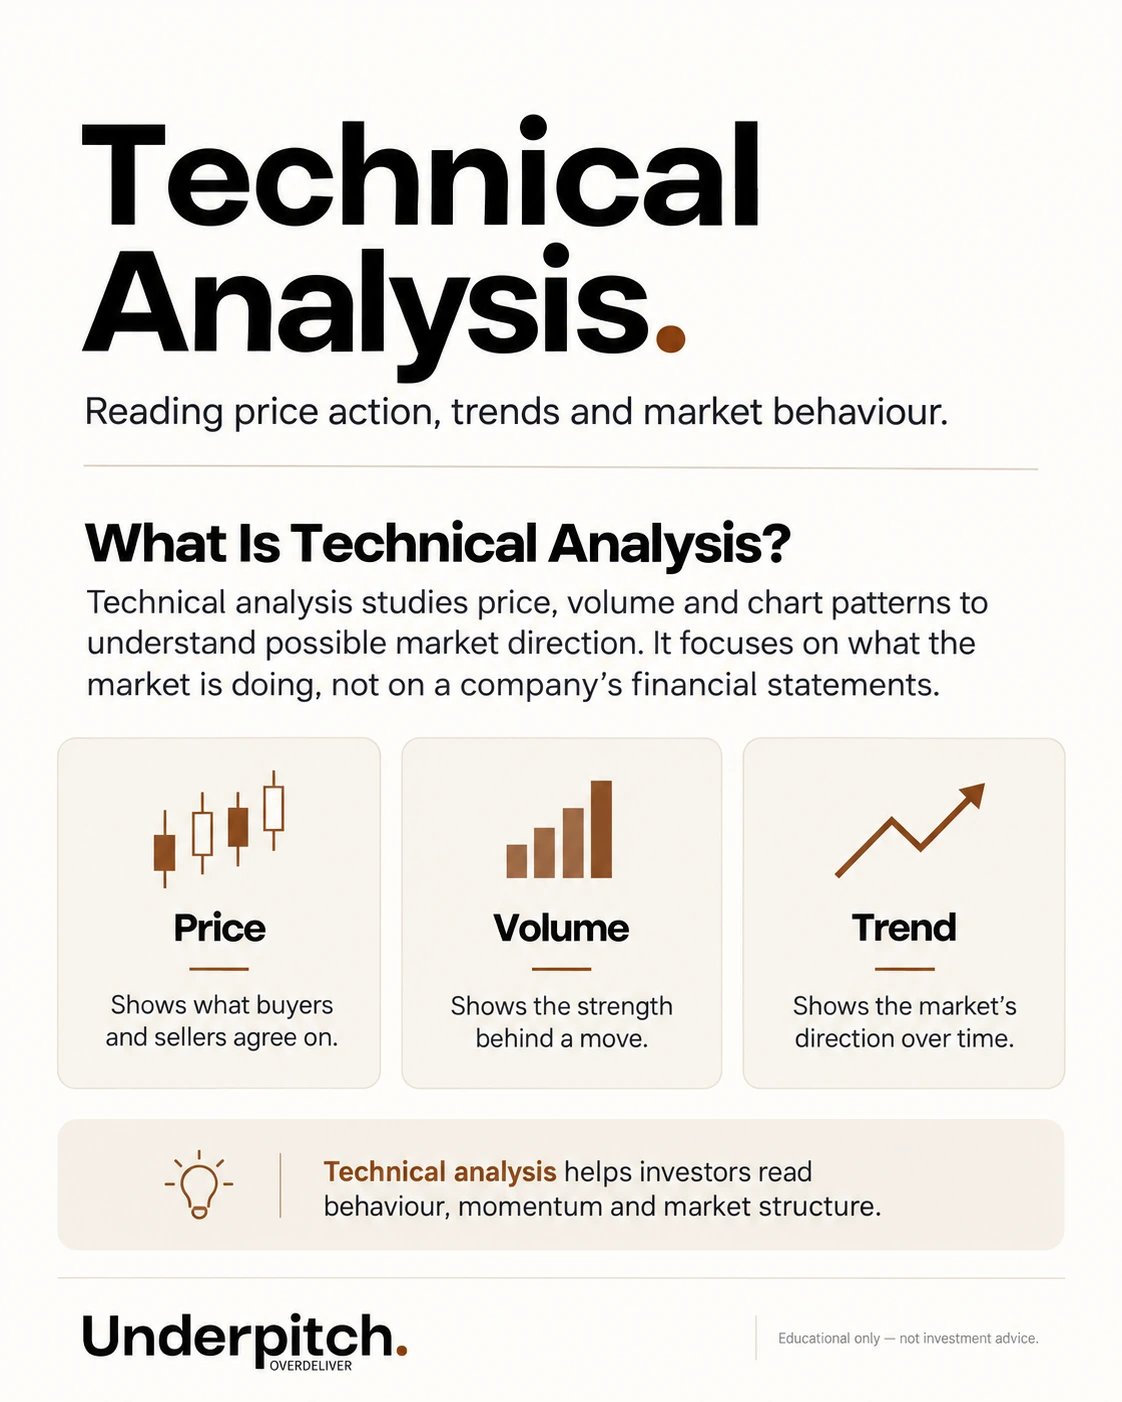
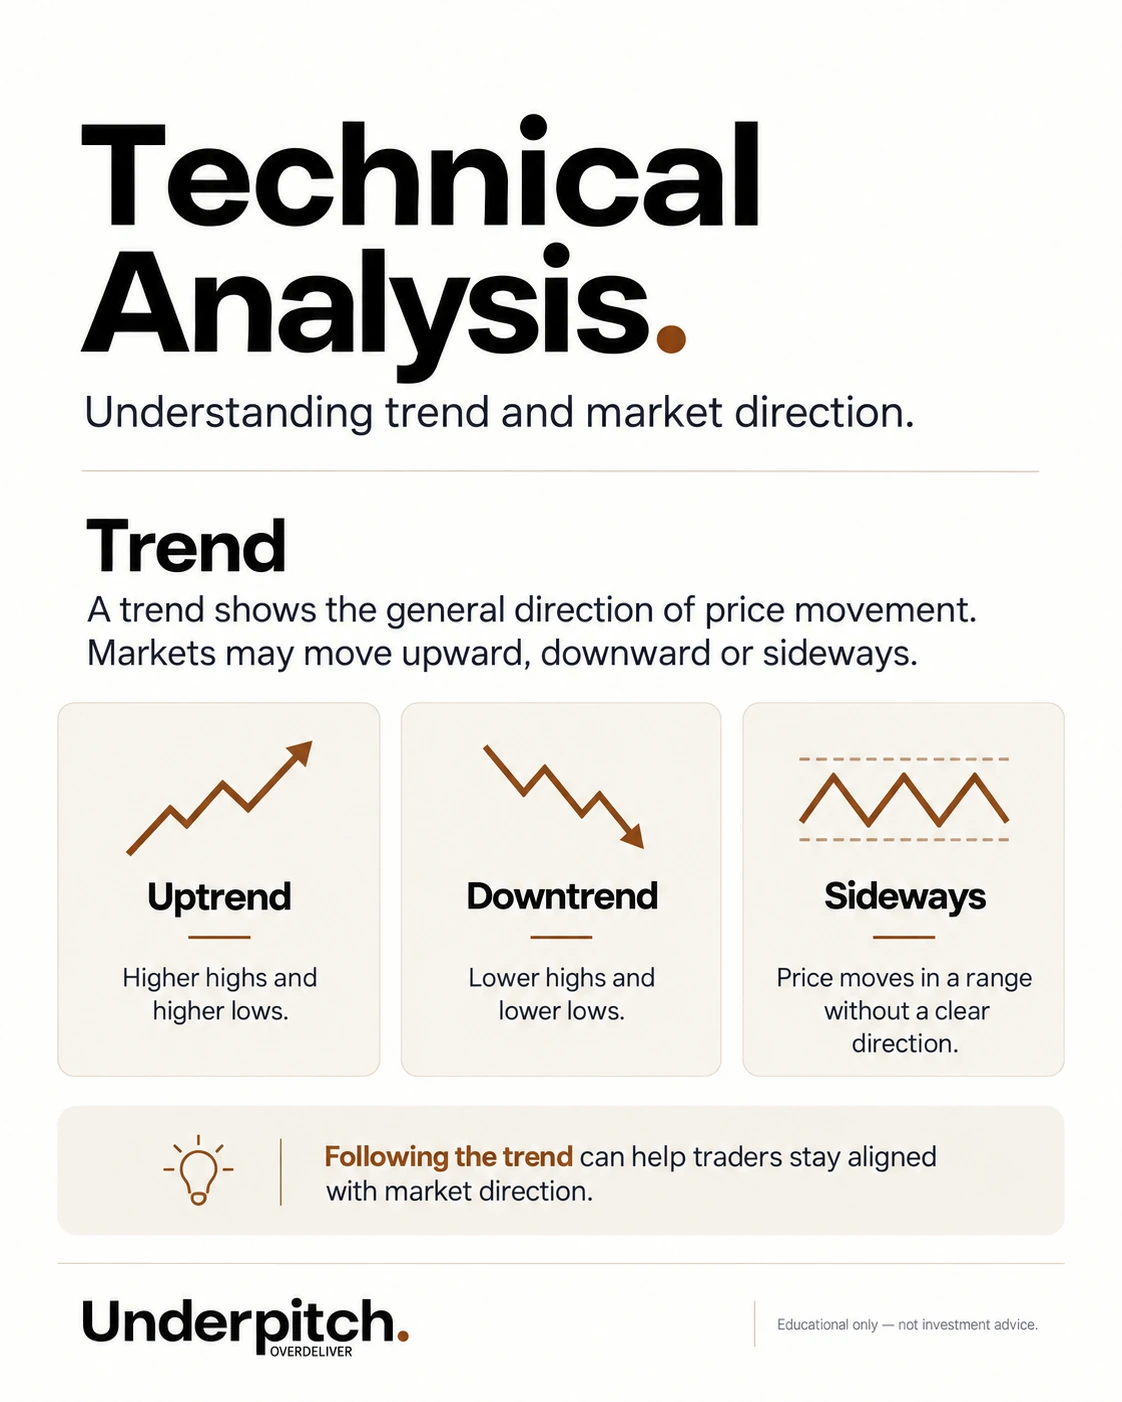
Technical analysis
Price behaviour first, then tools and risk.


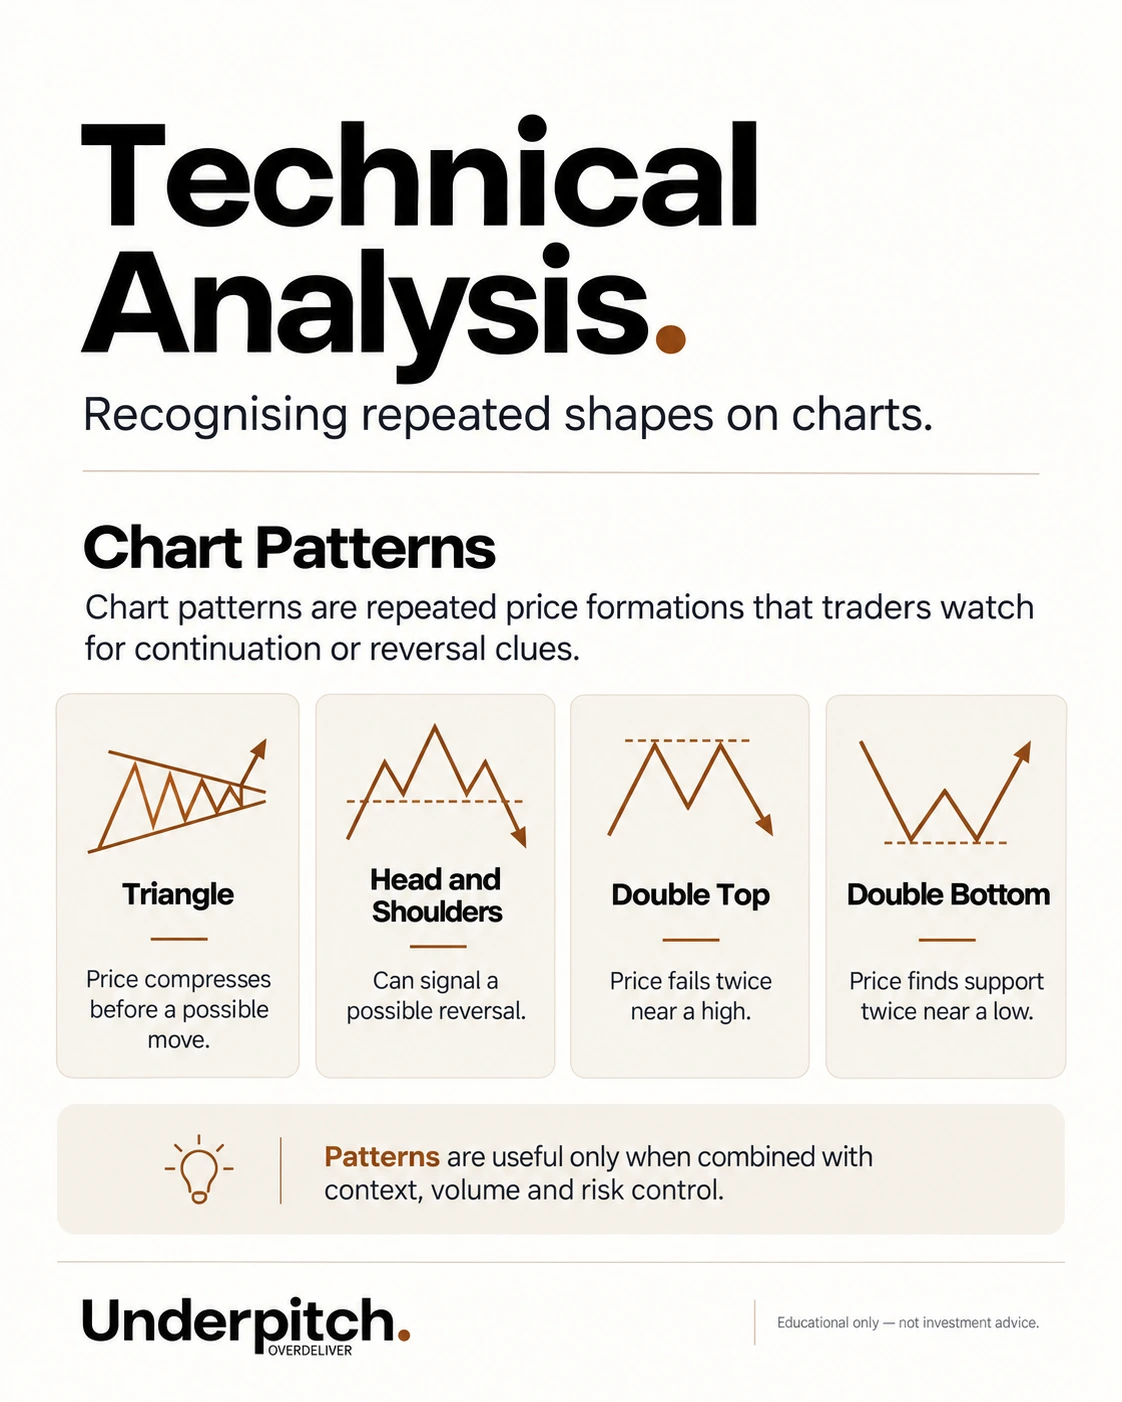

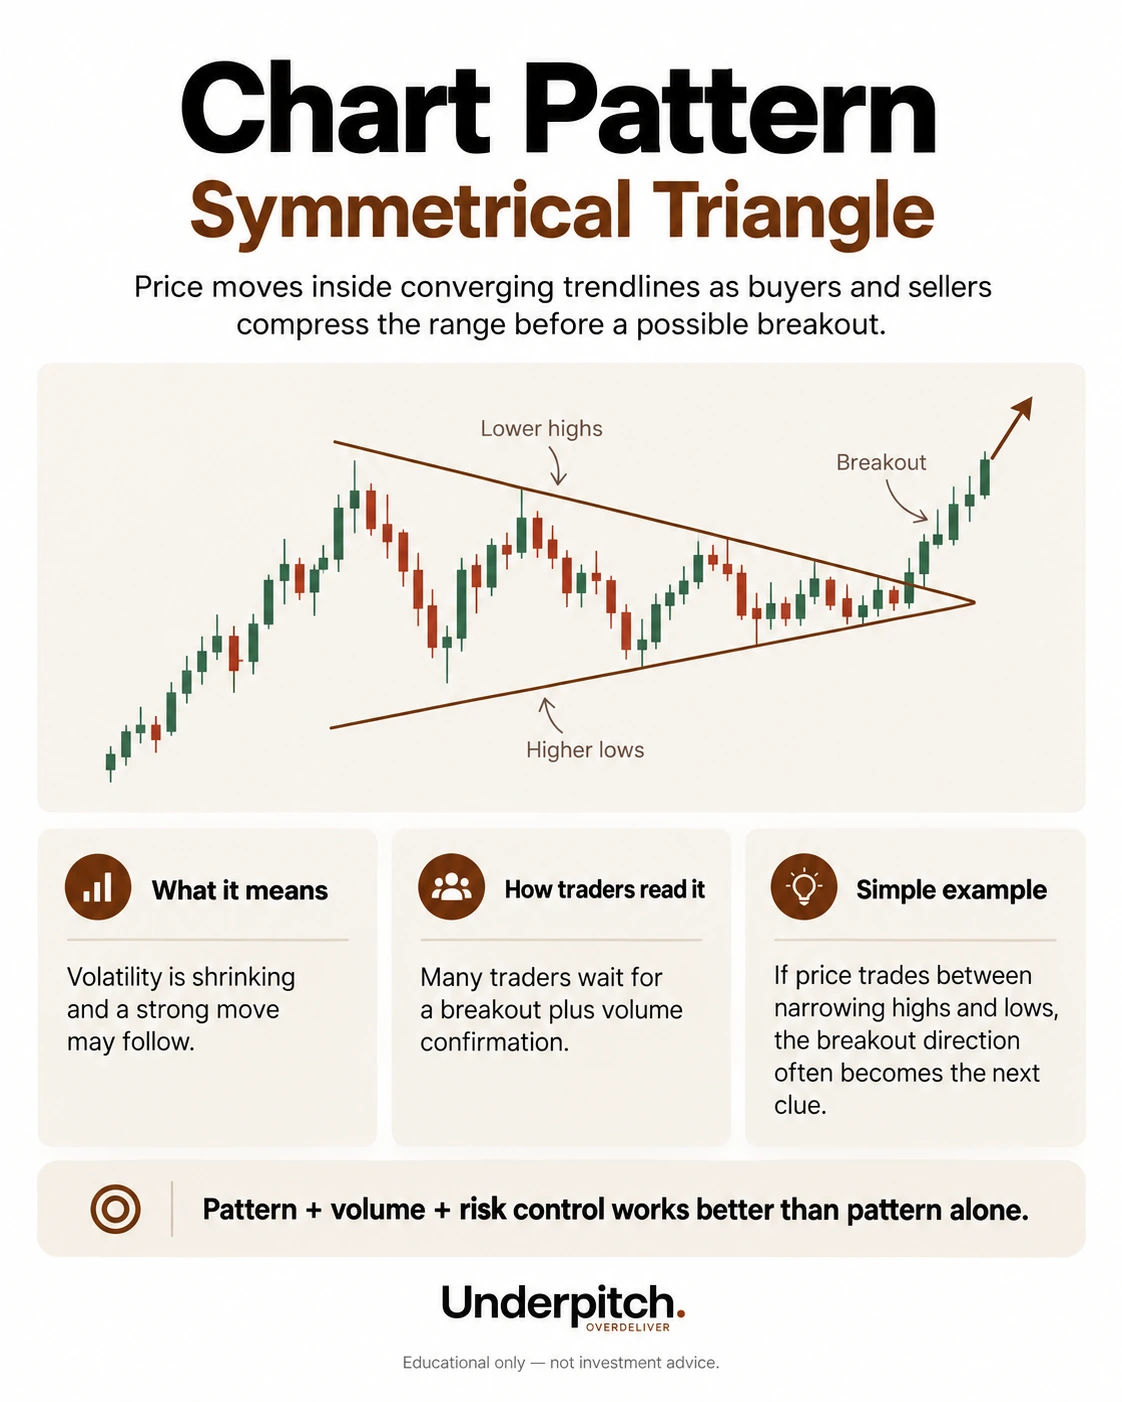
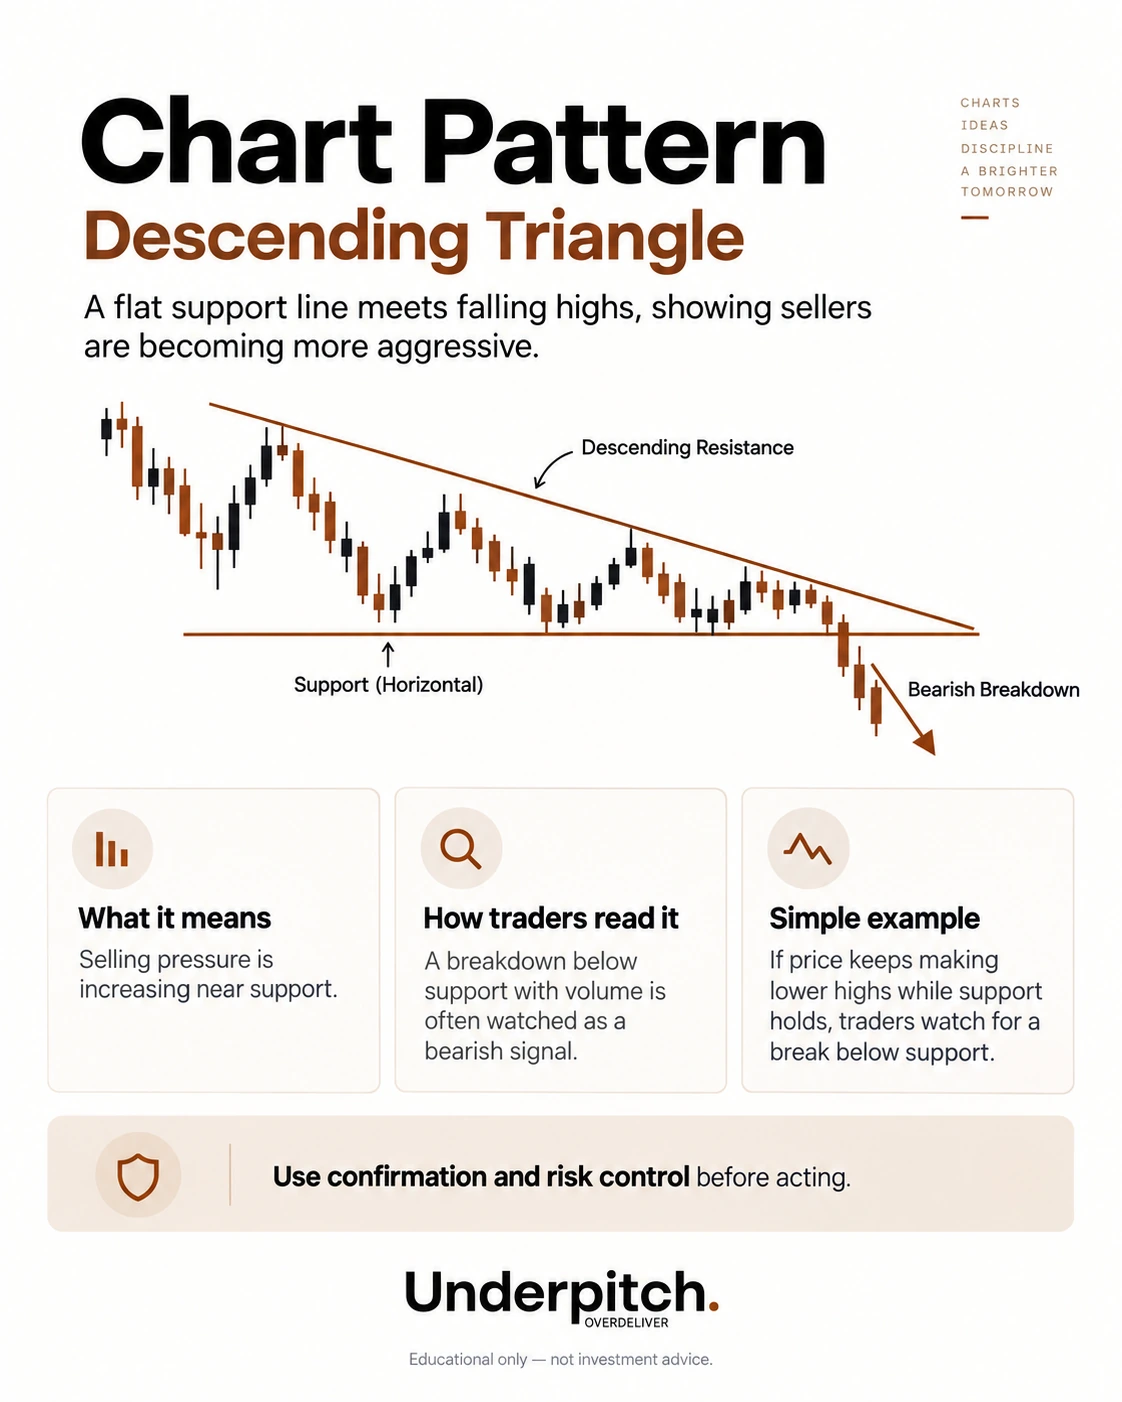
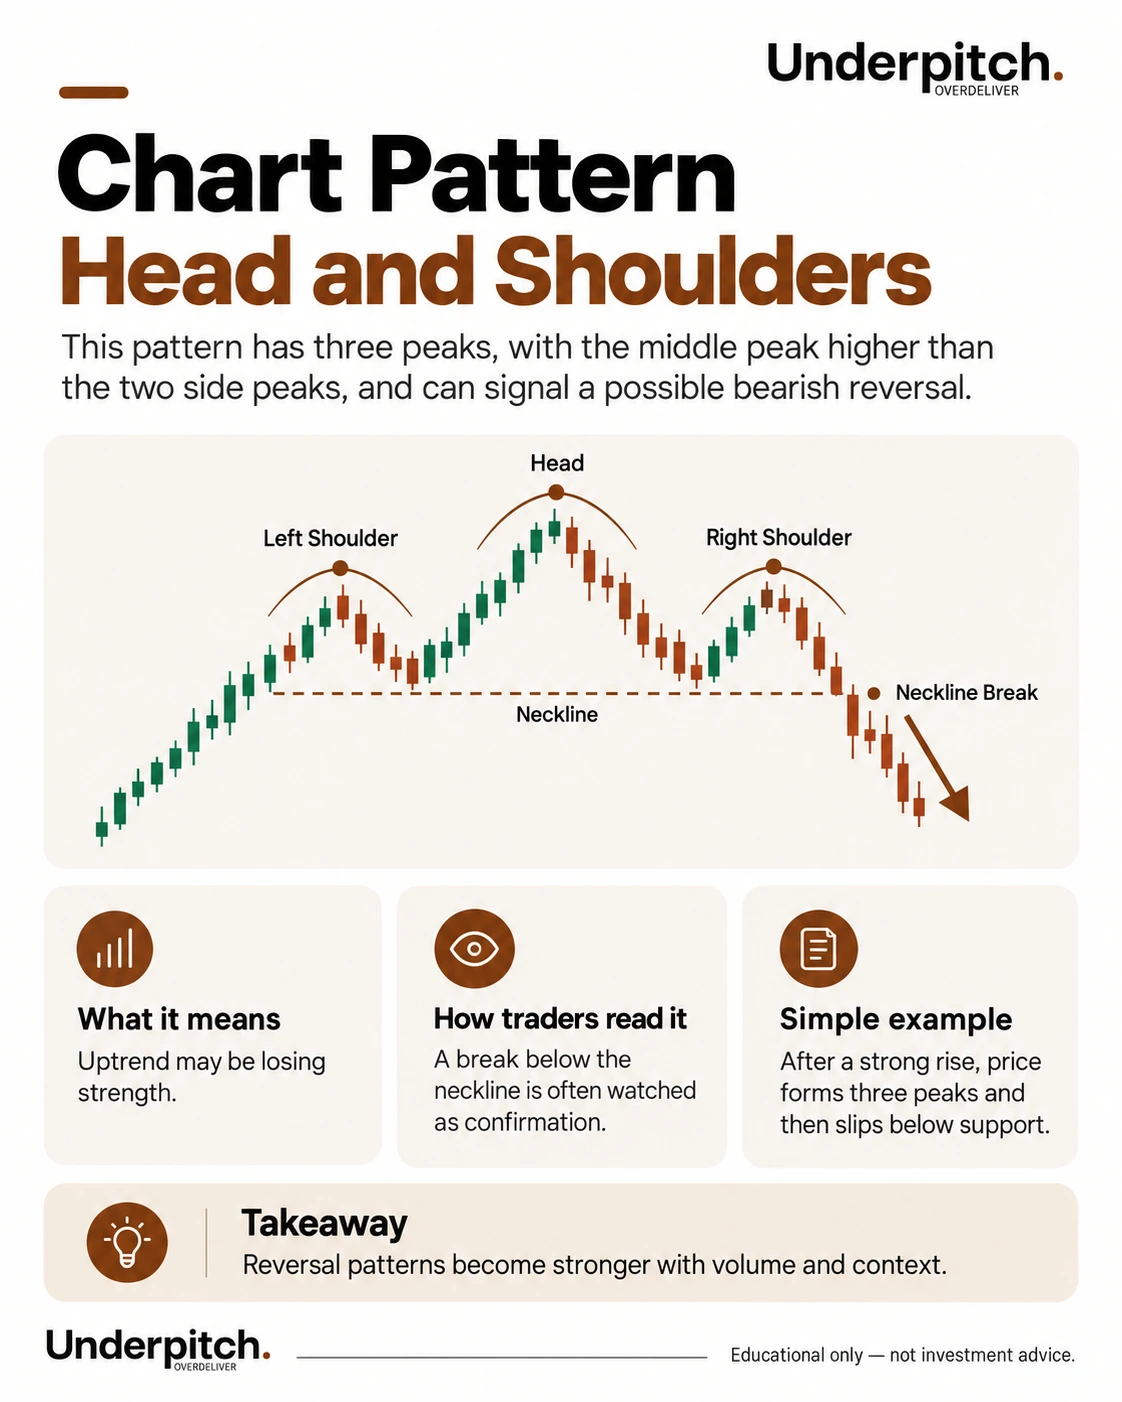
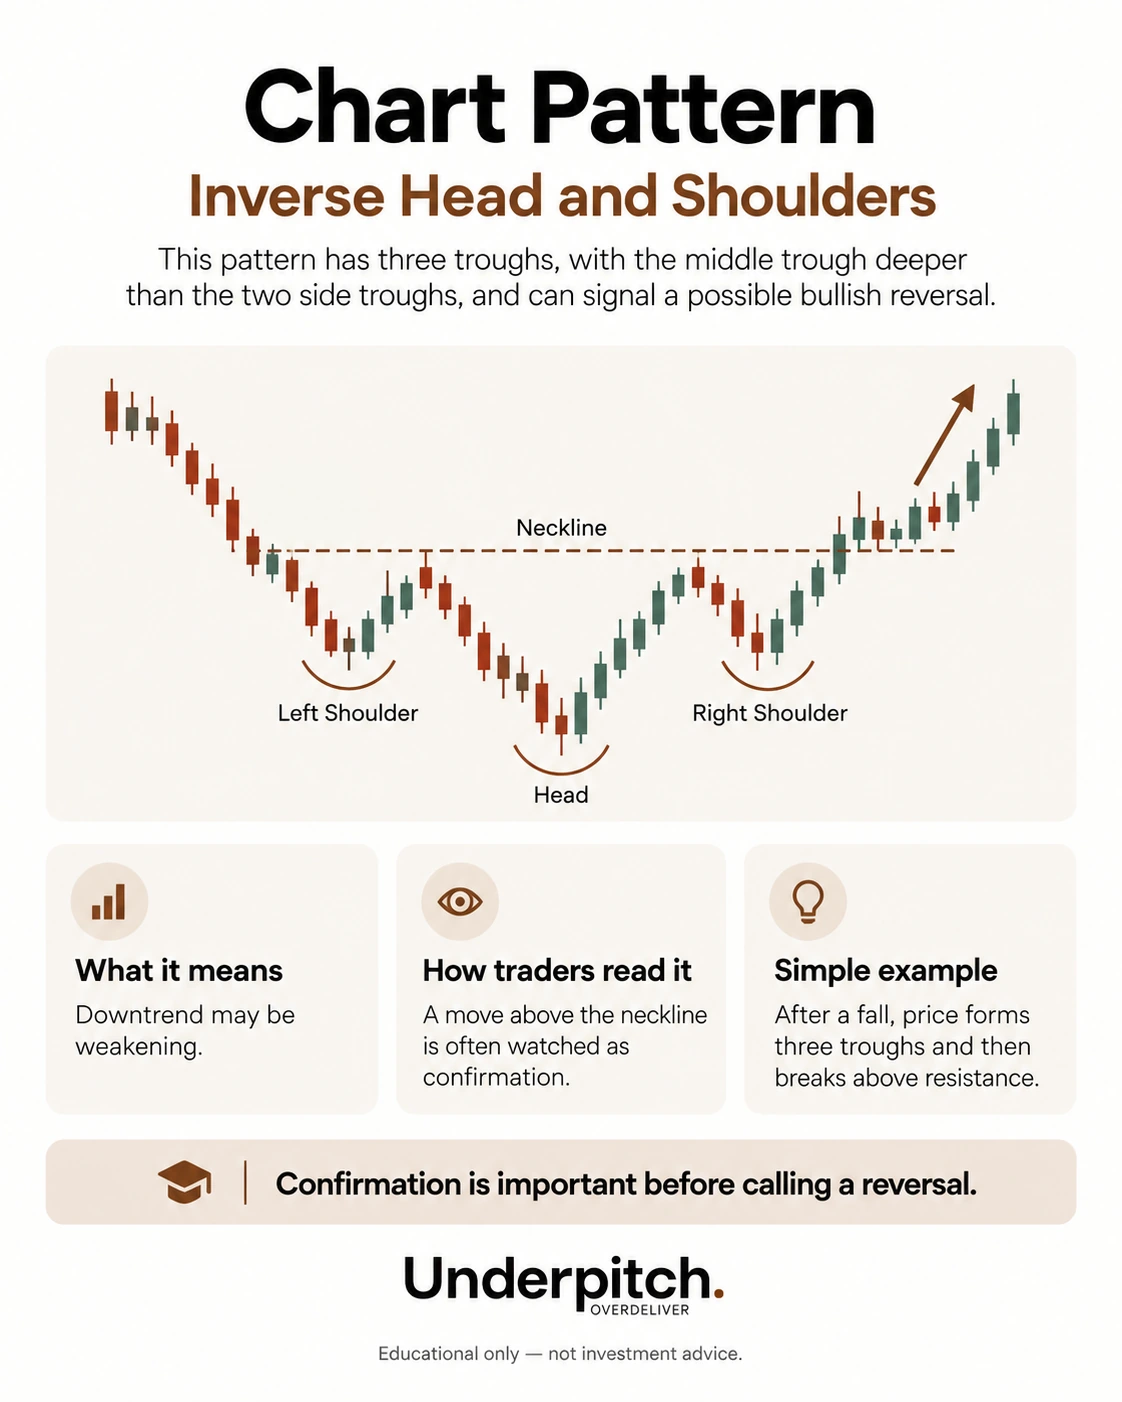
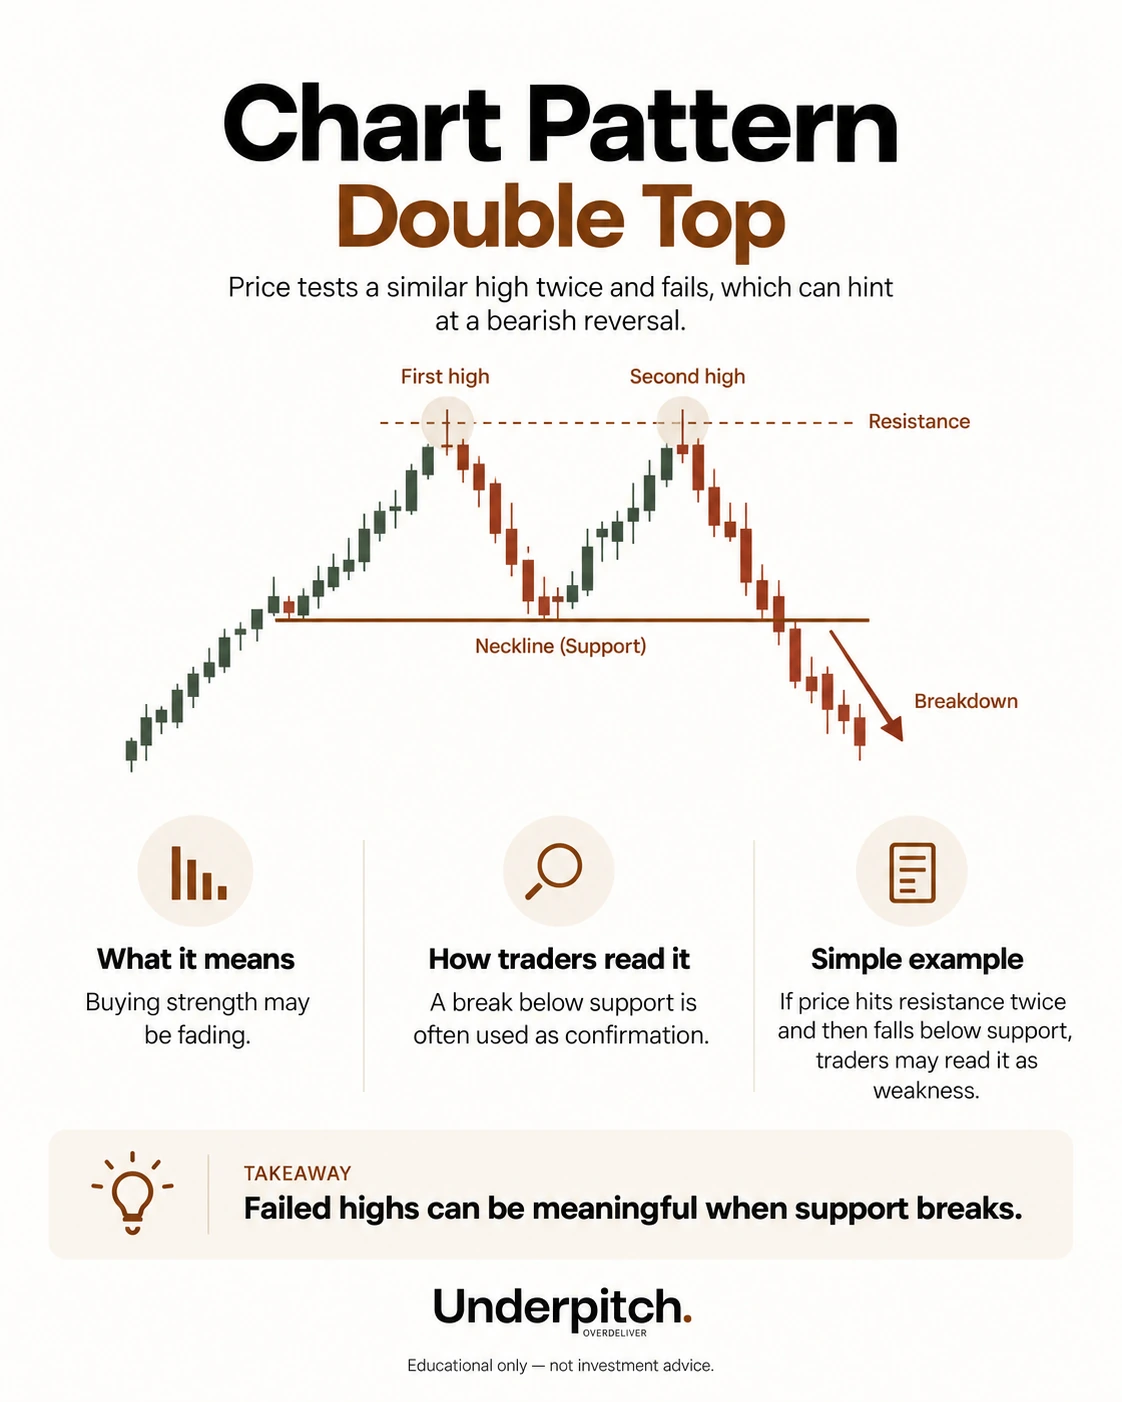
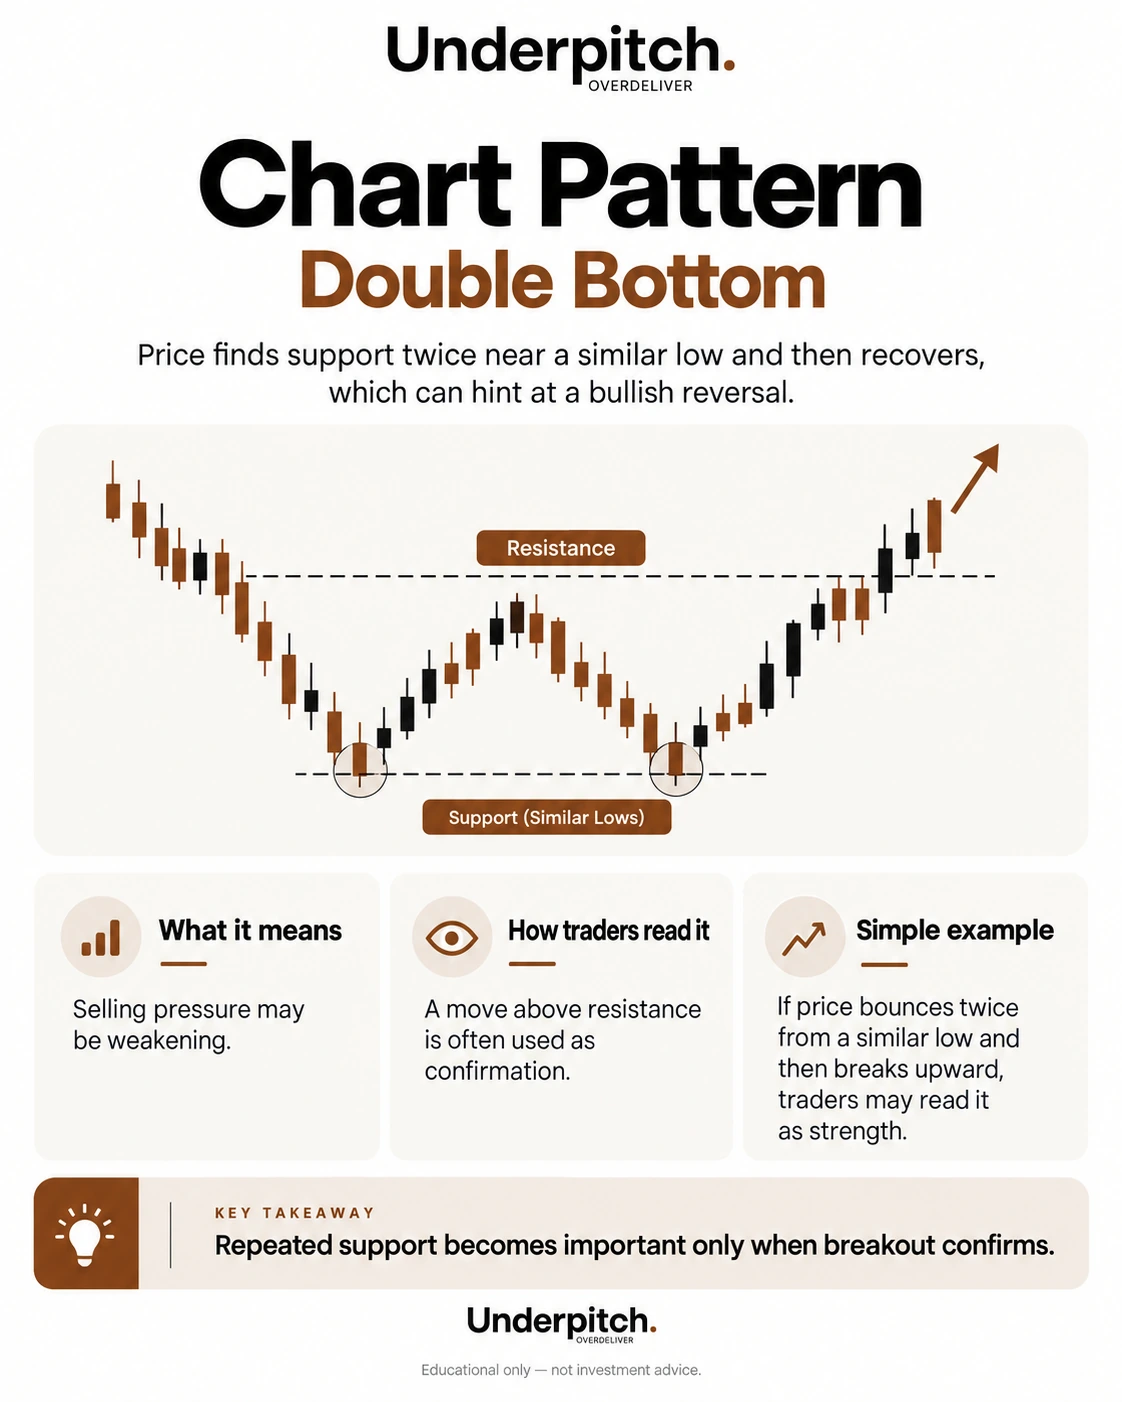
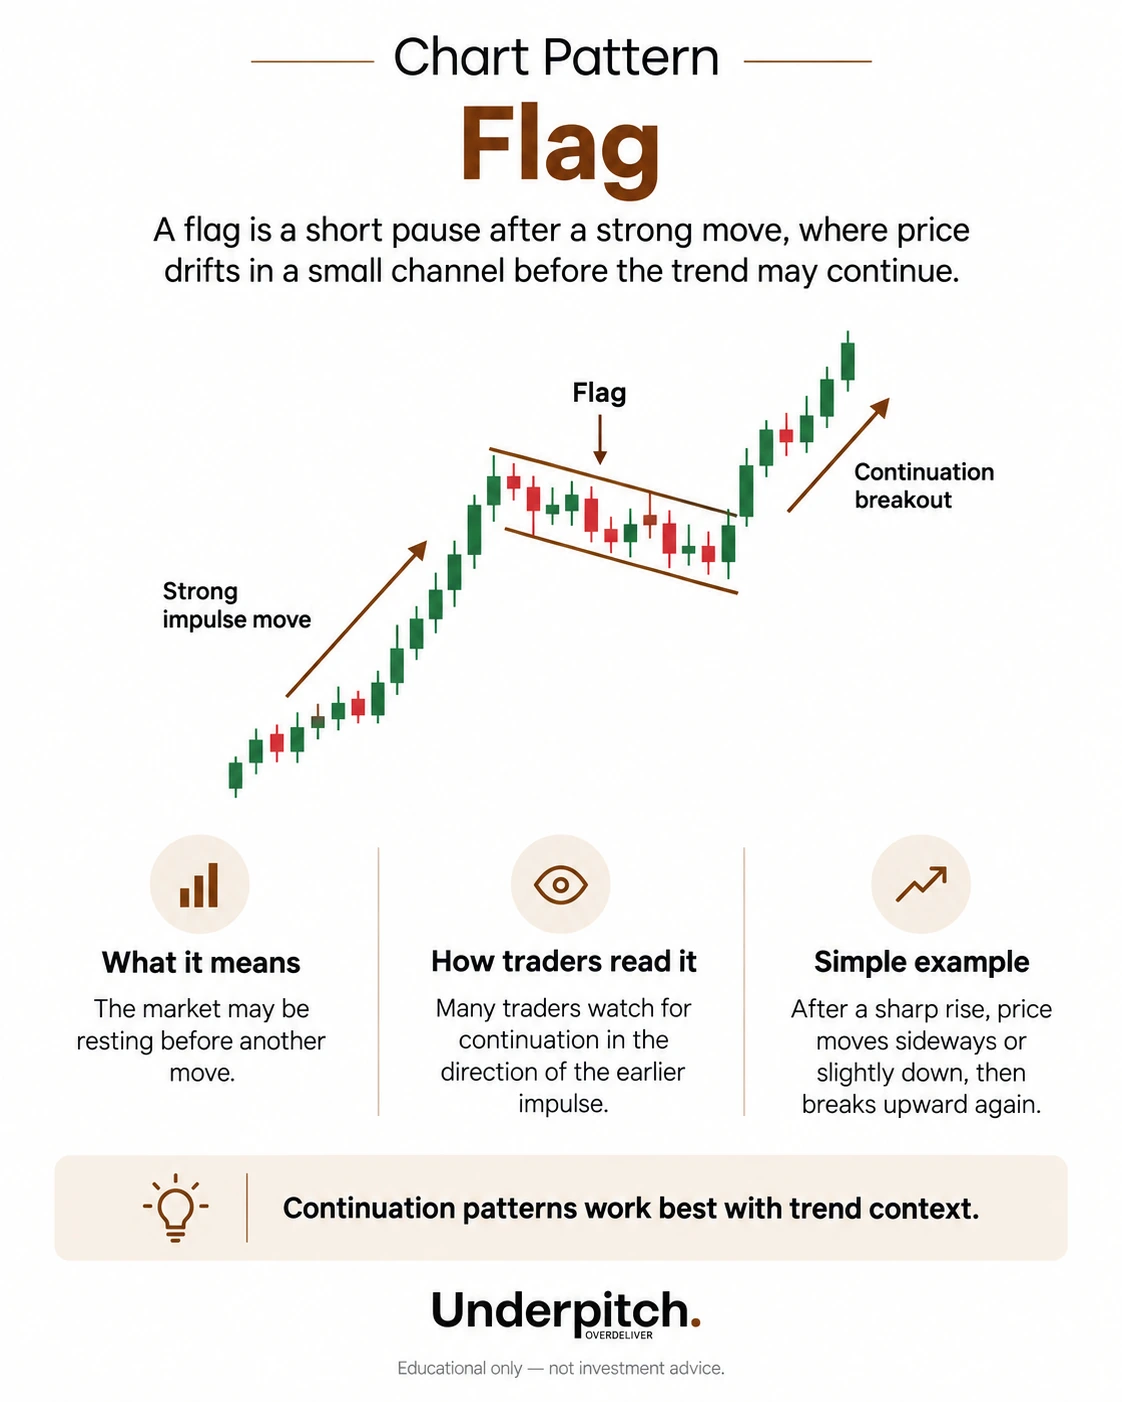
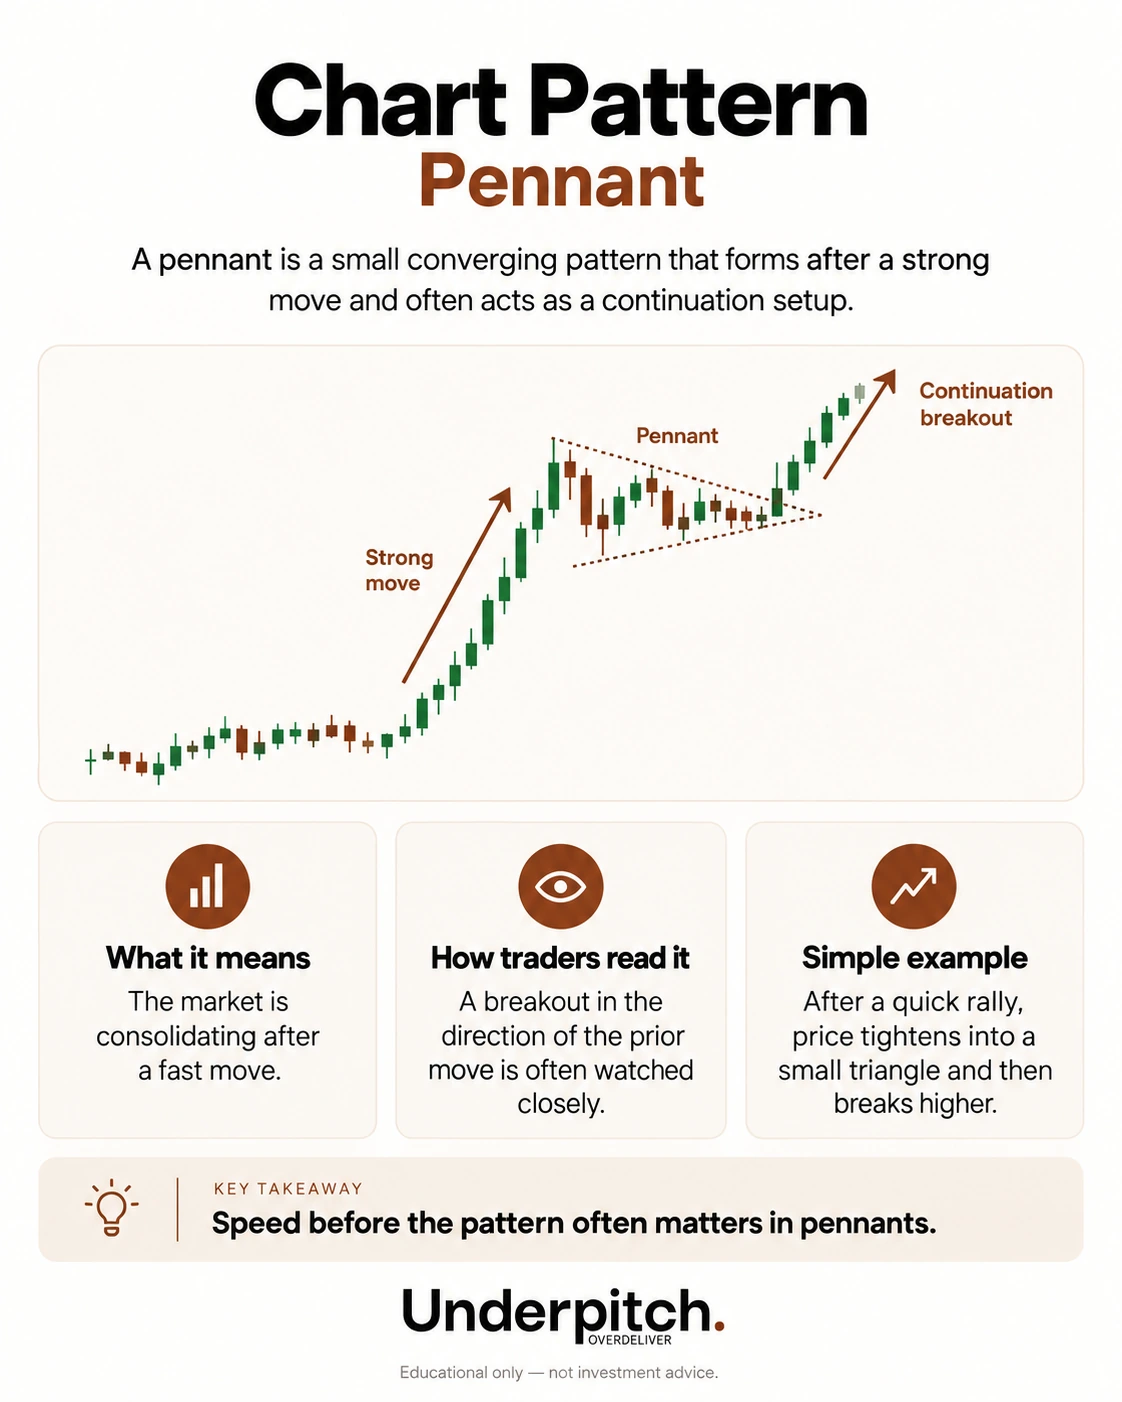
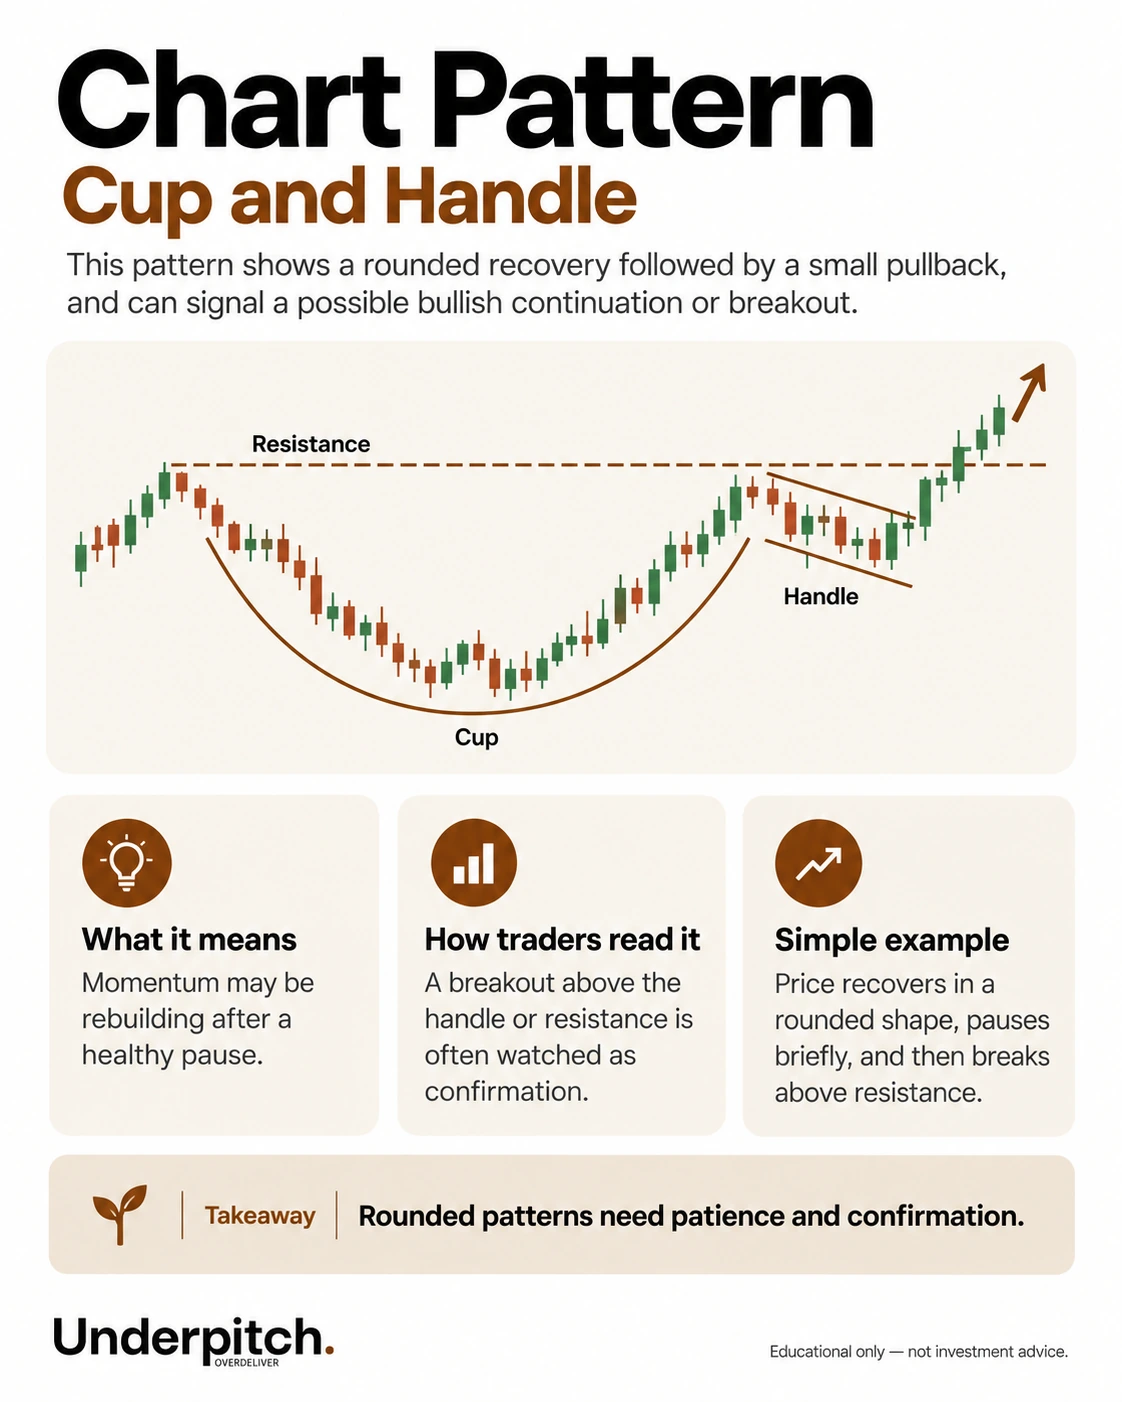
Common chart patterns
Patterns are ordered from triangles to reversal and continuation structures.

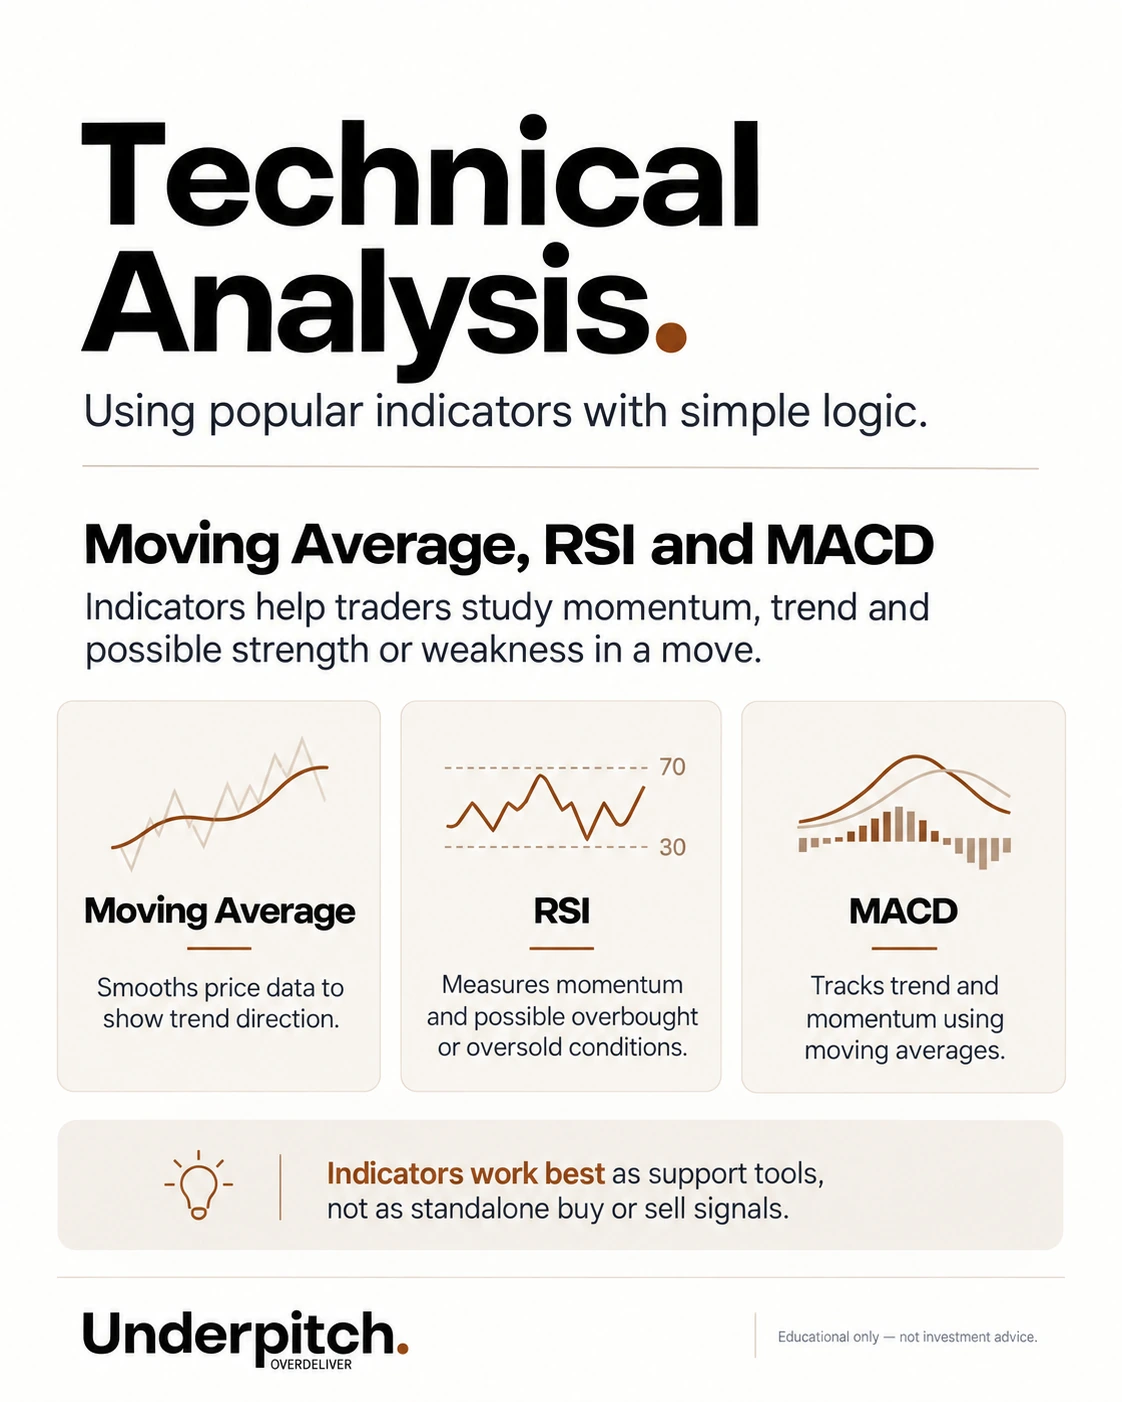
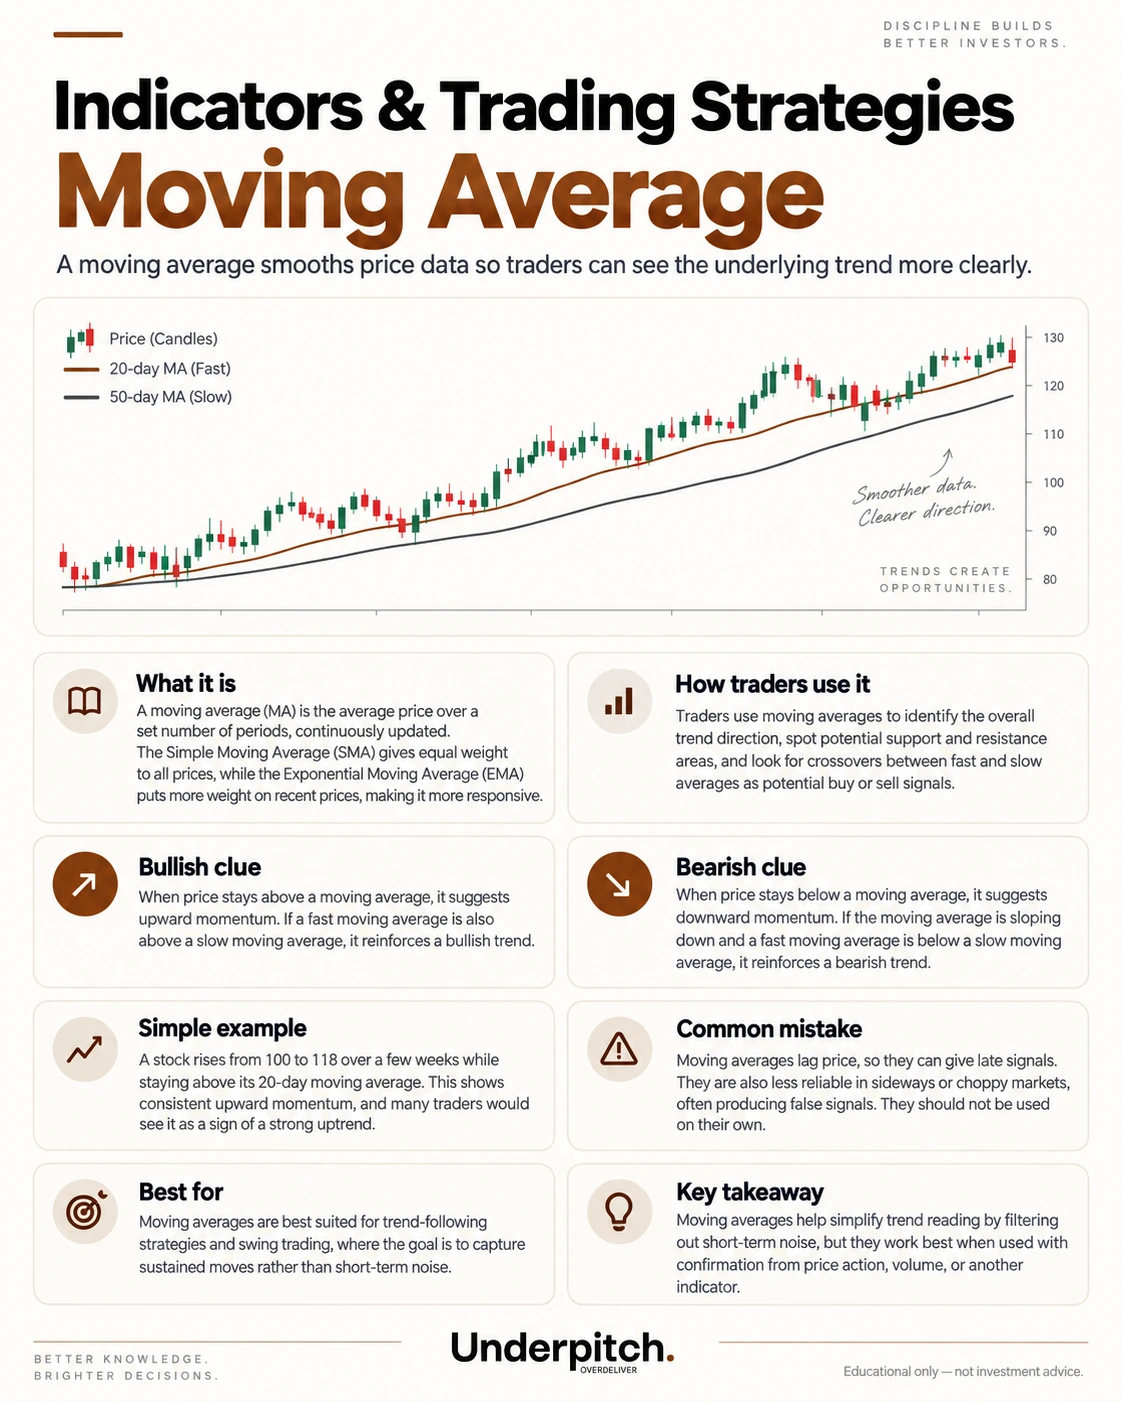
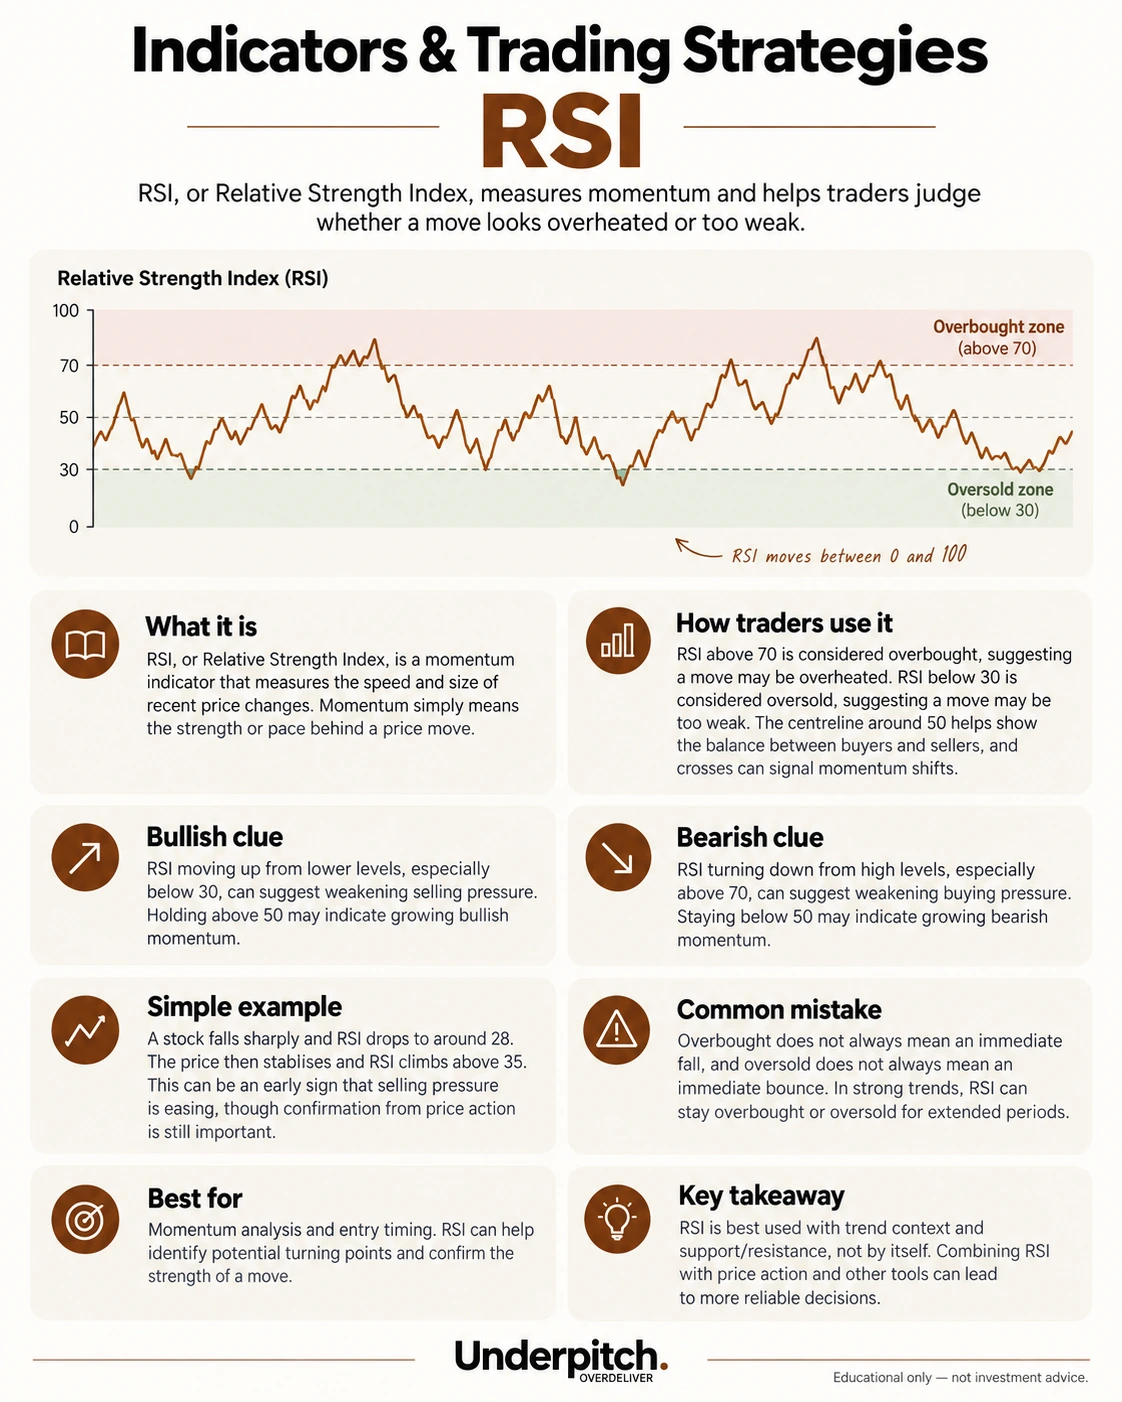
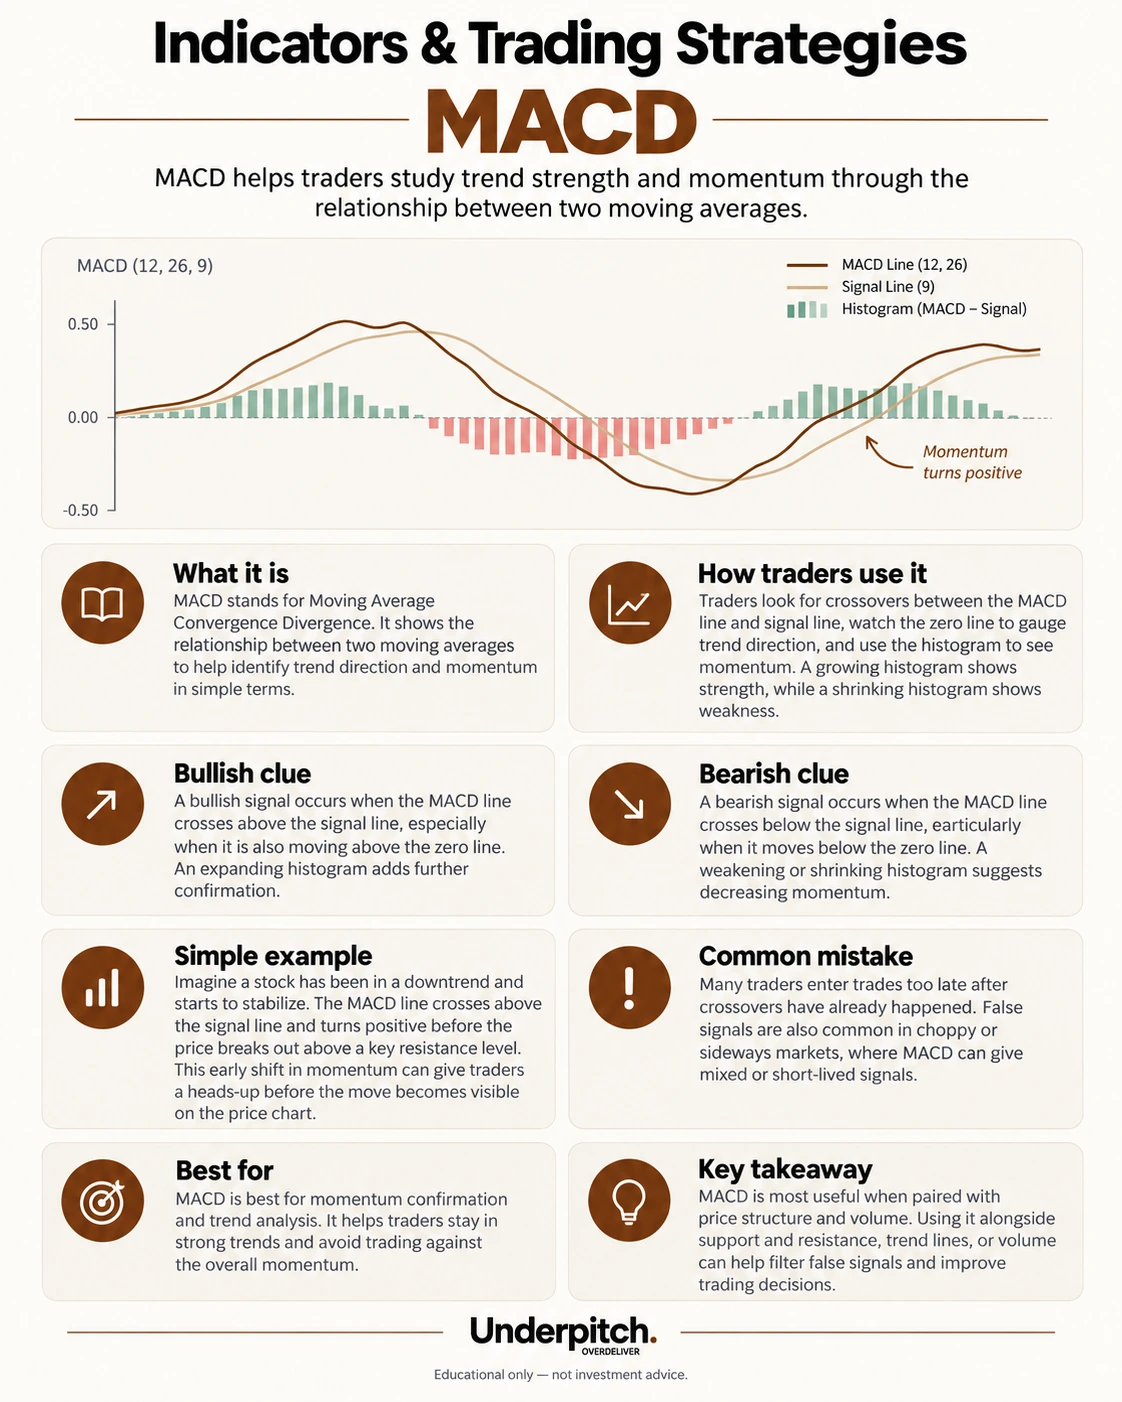
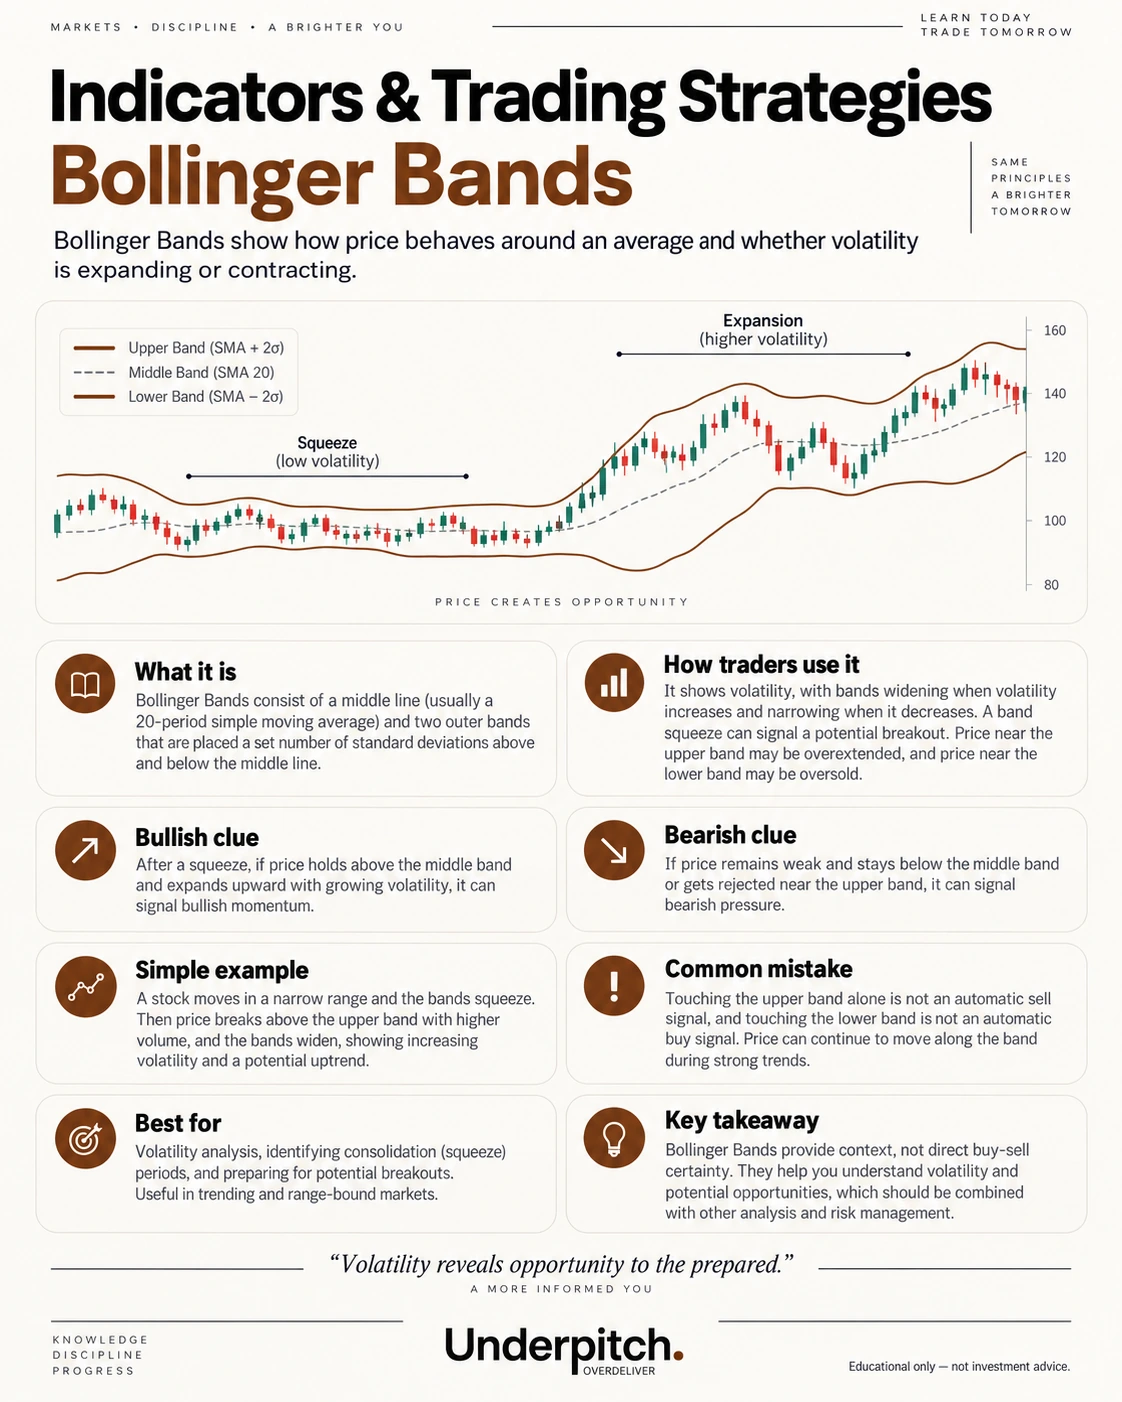
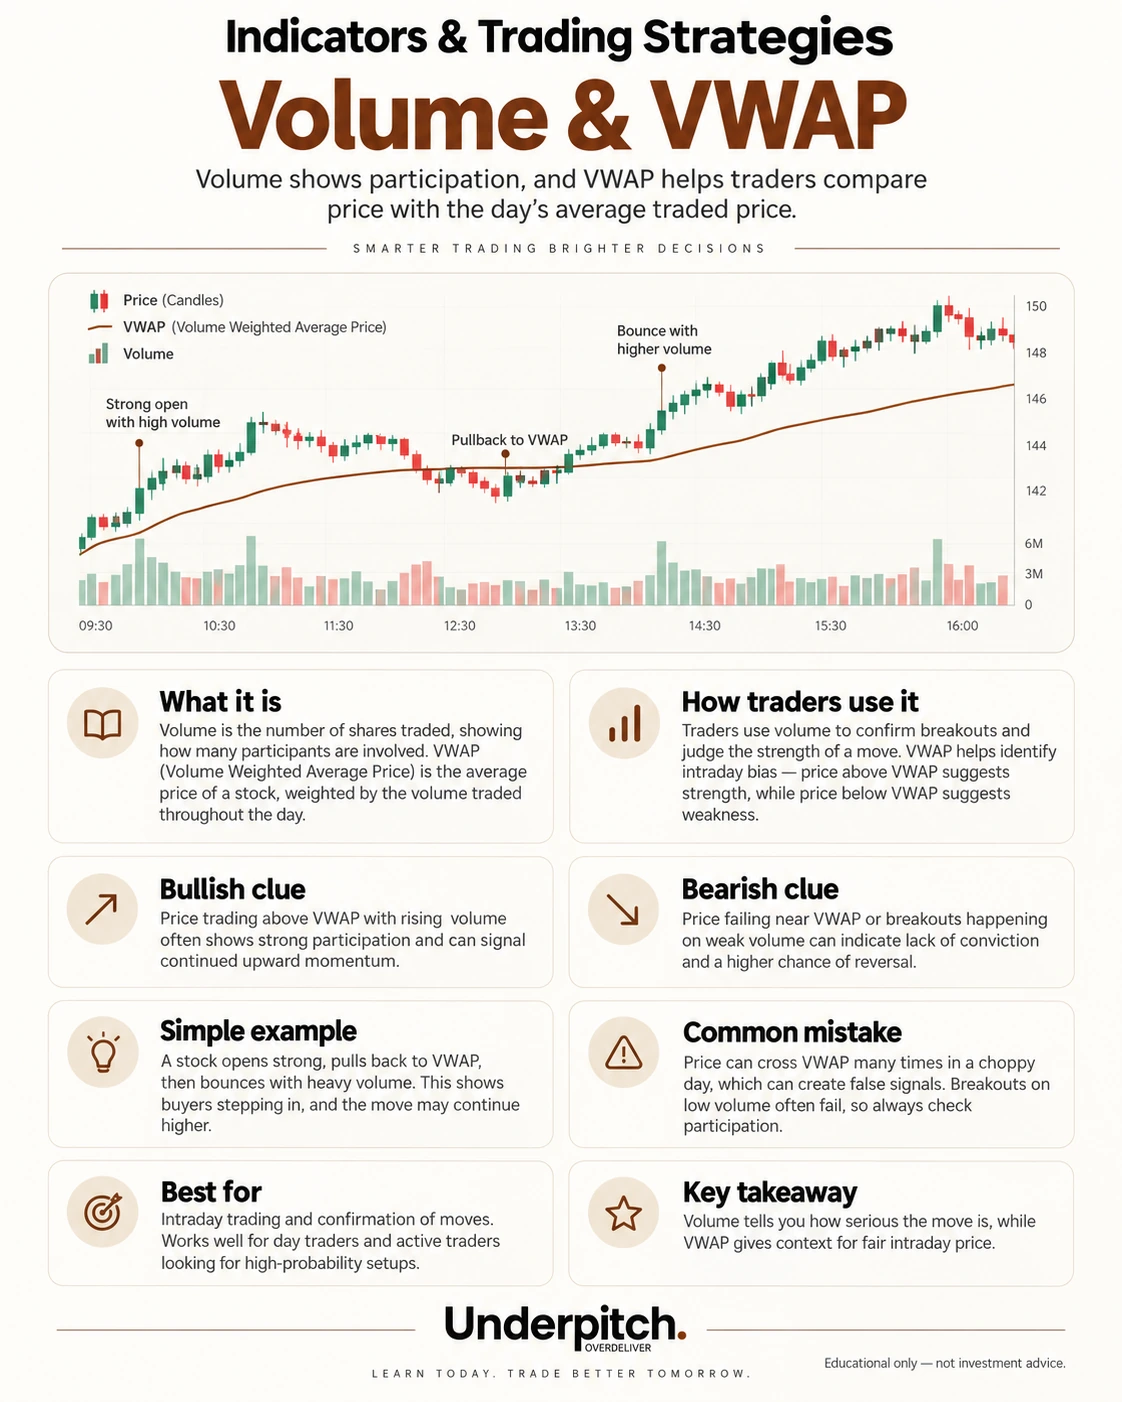
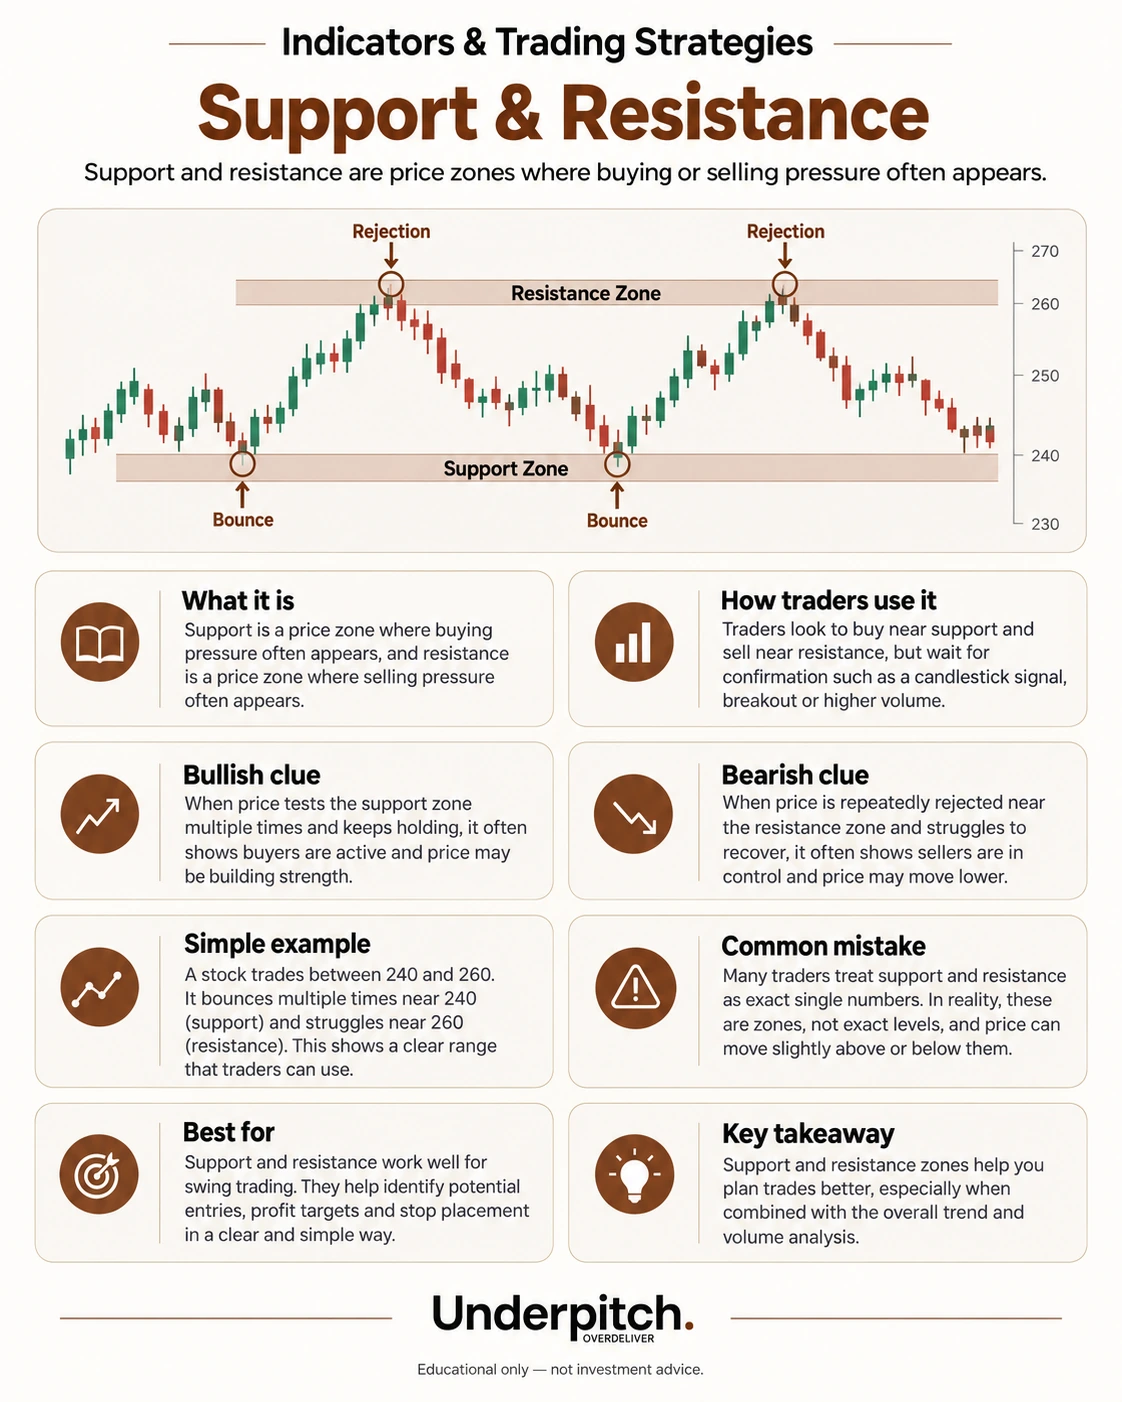
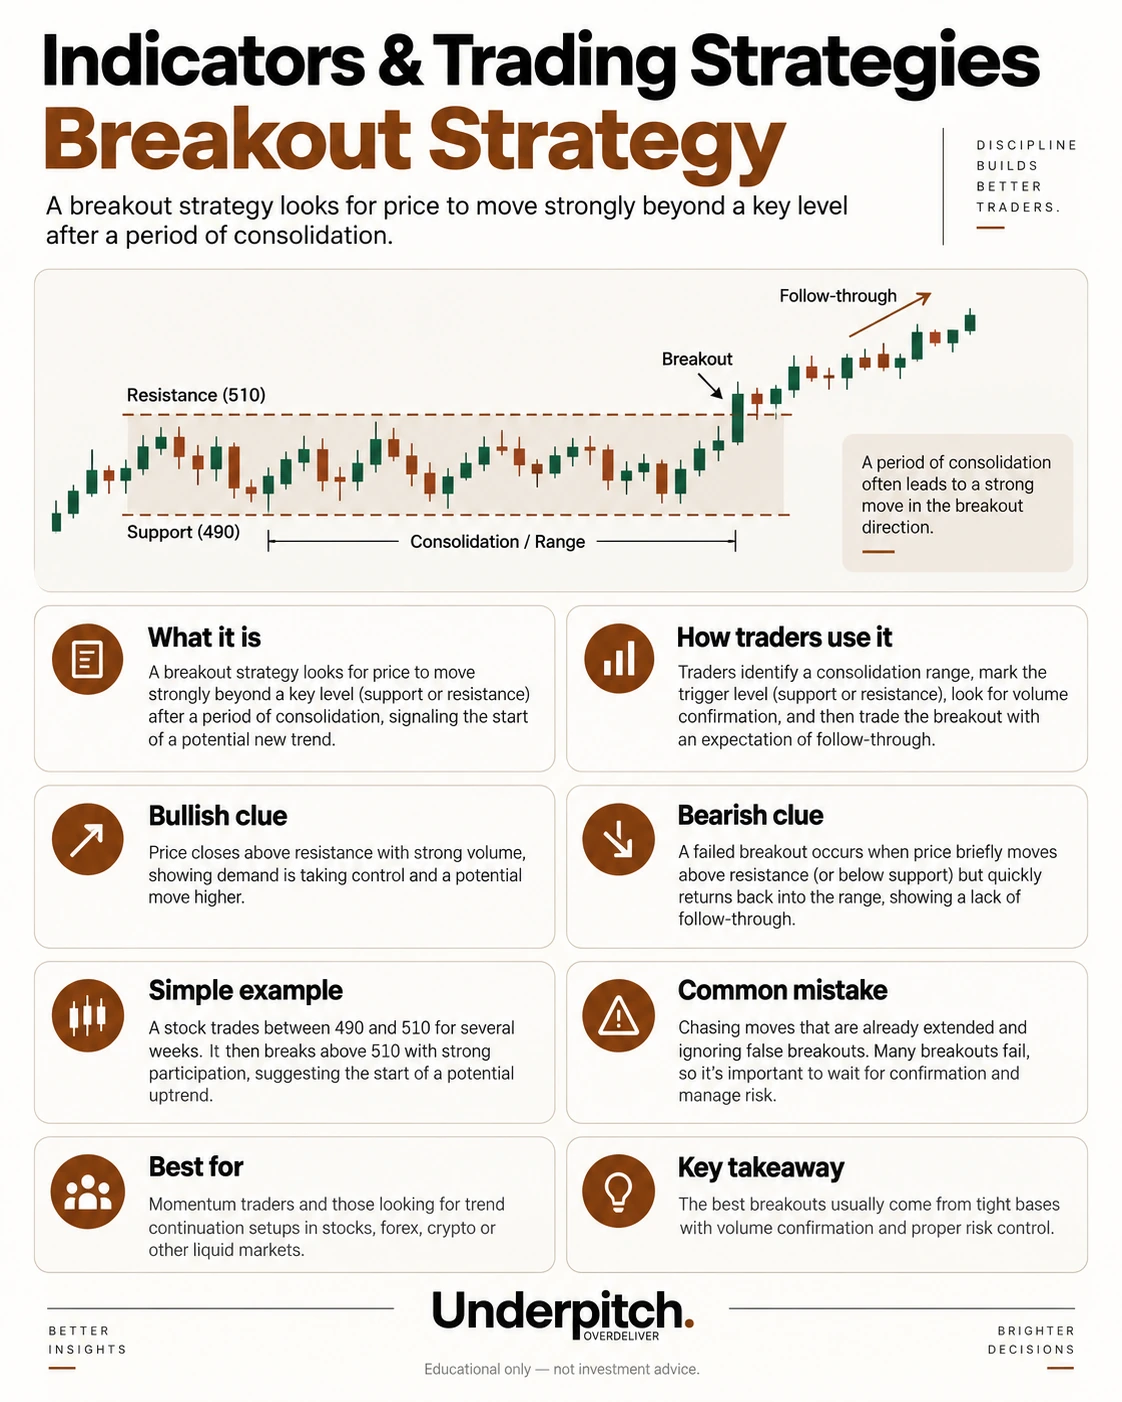
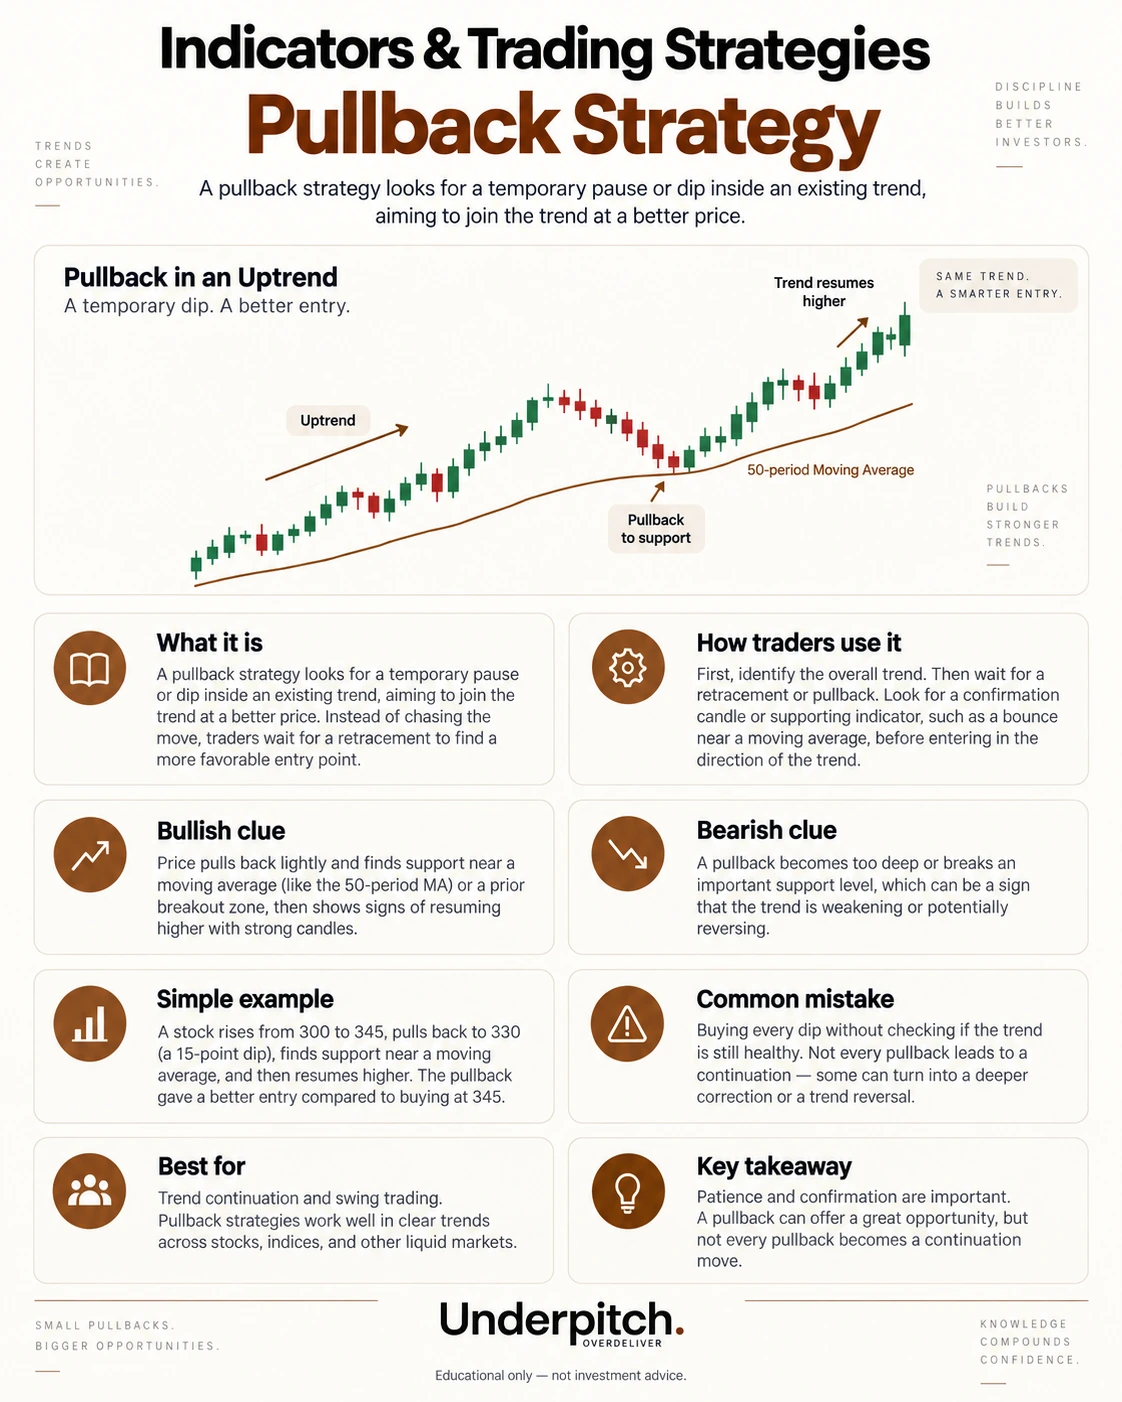
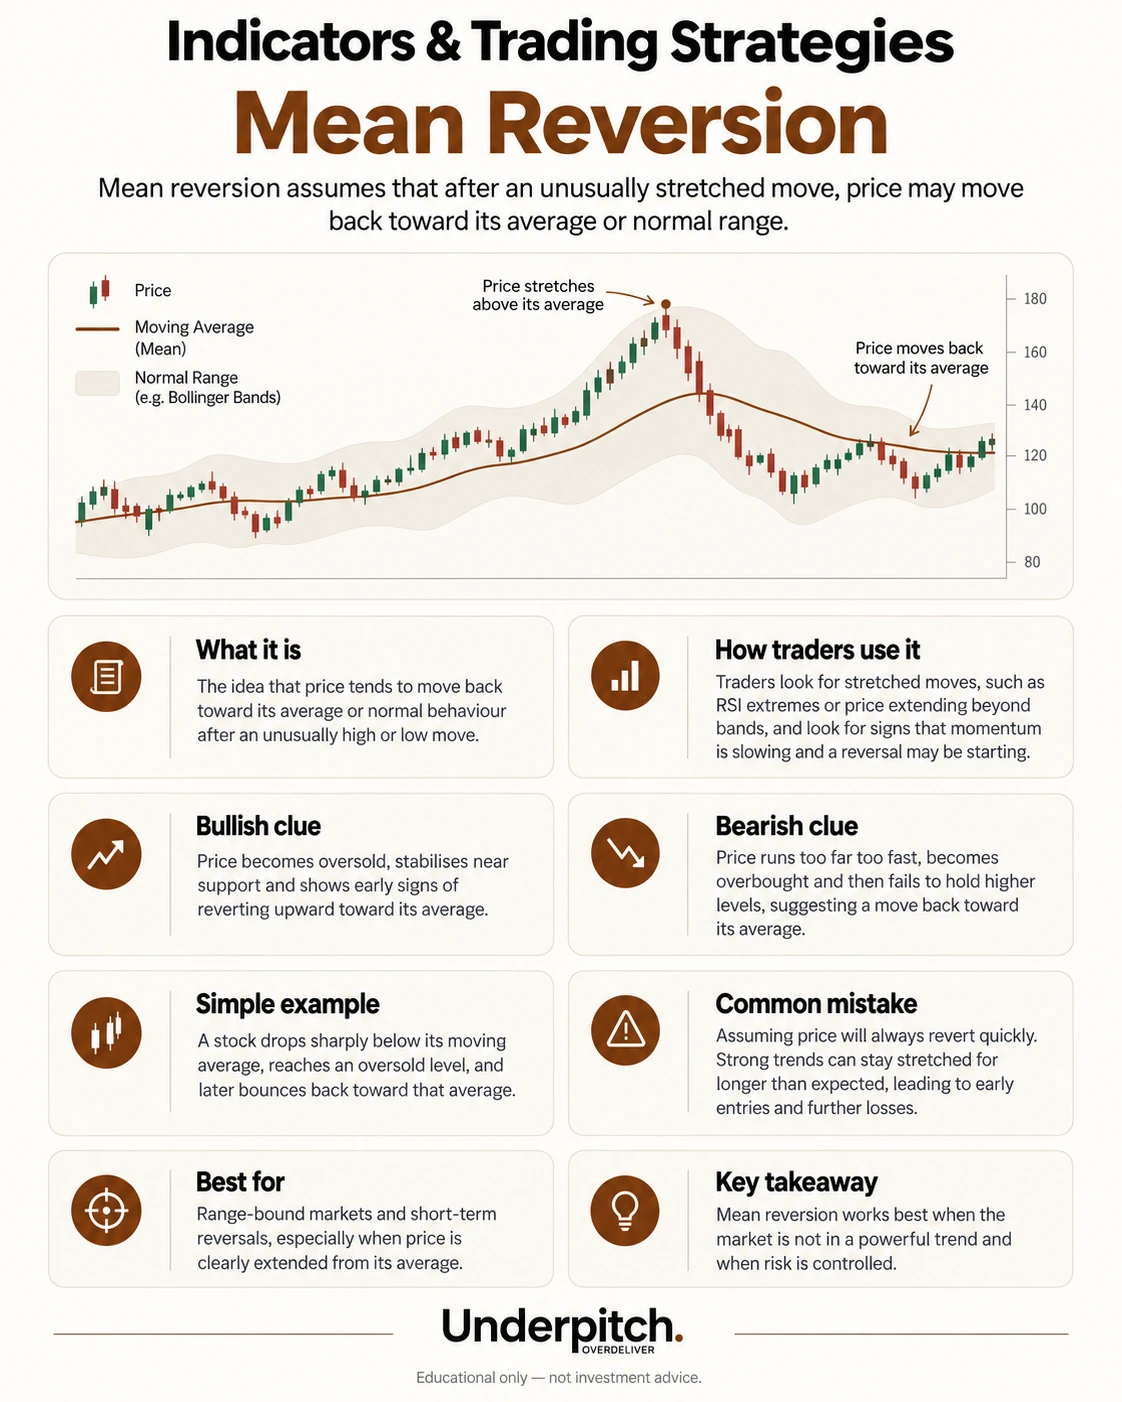
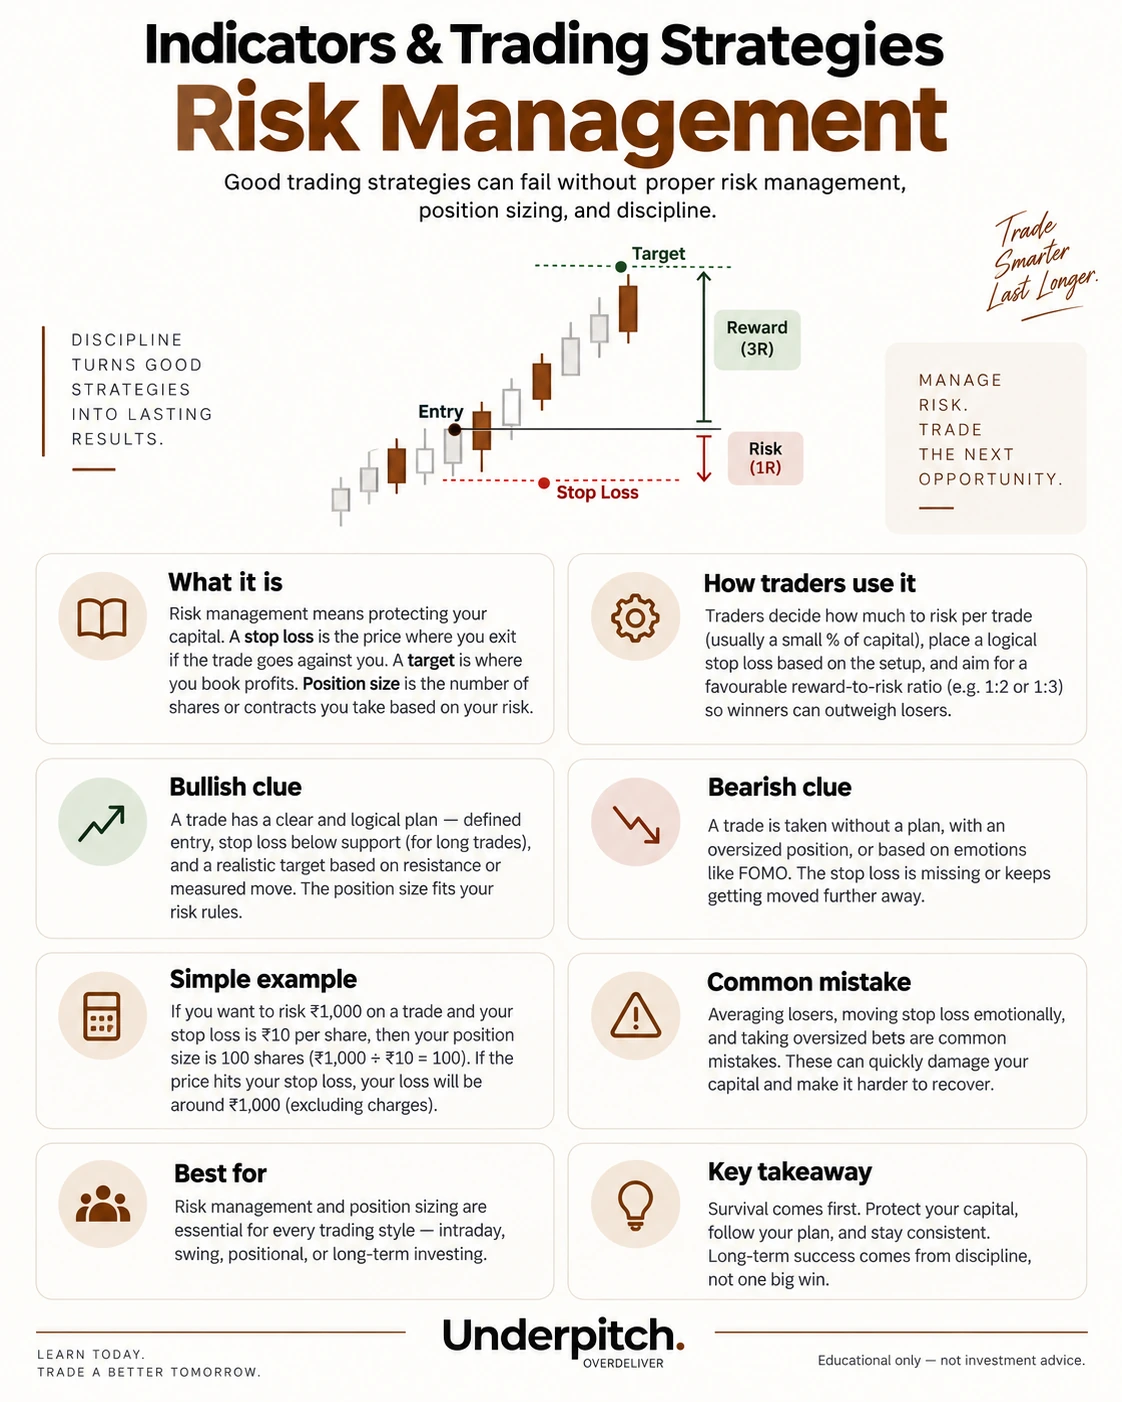
Indicators & trading strategies
Indicator explanations followed by strategy logic and risk management.
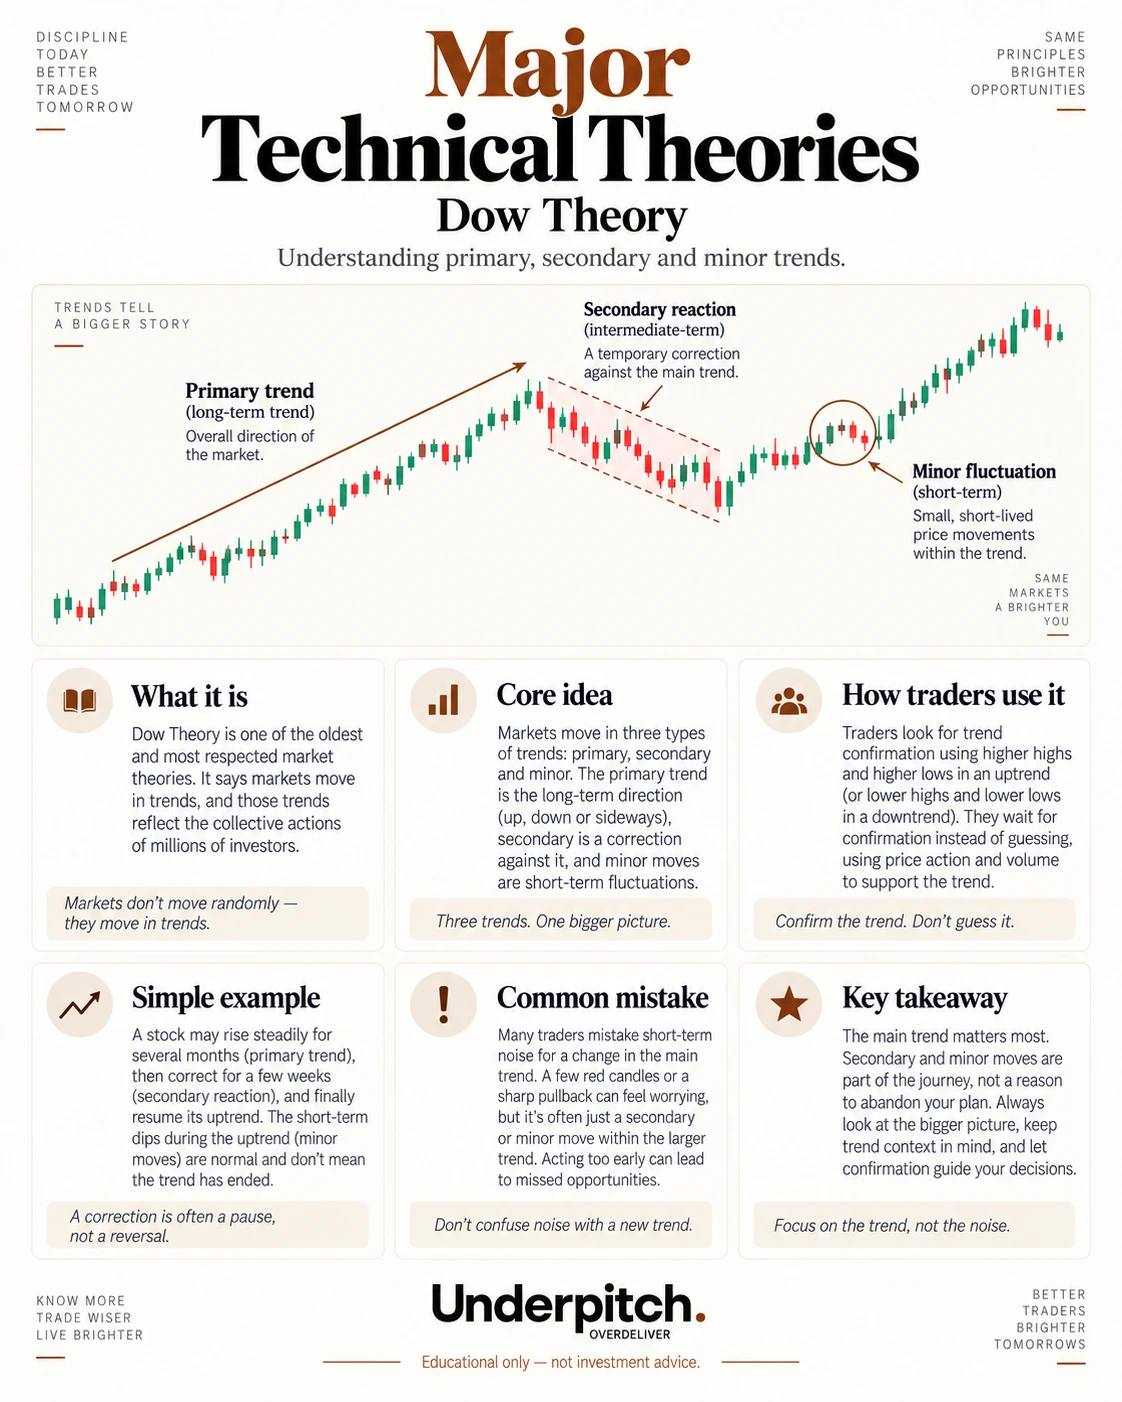
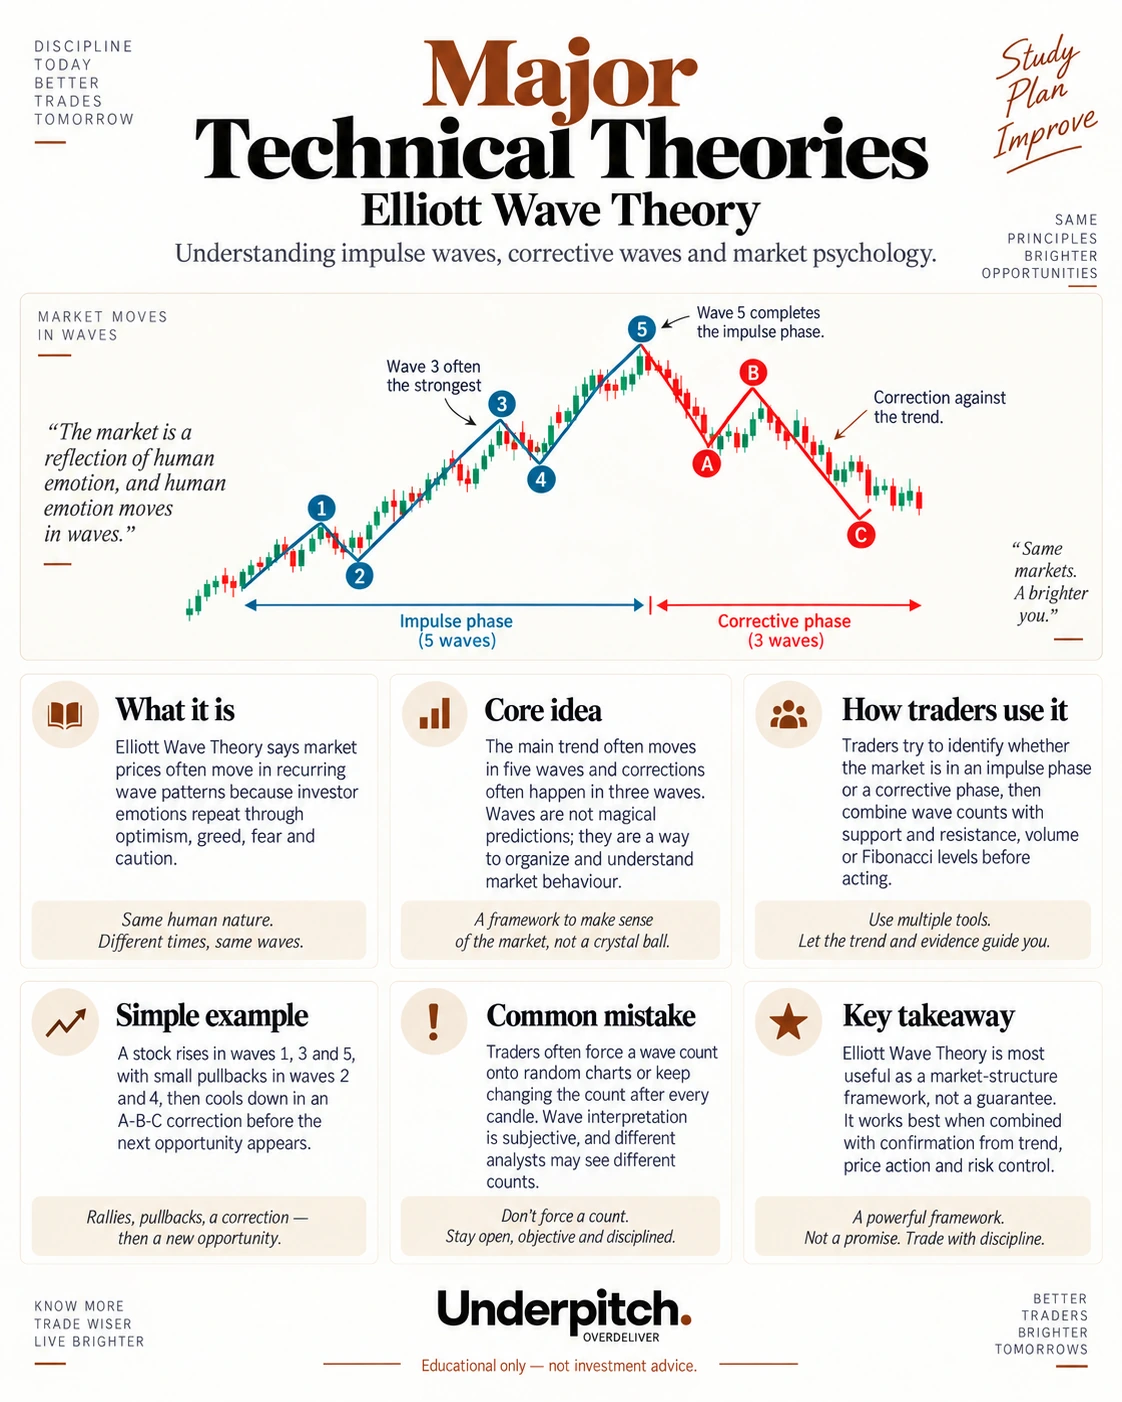
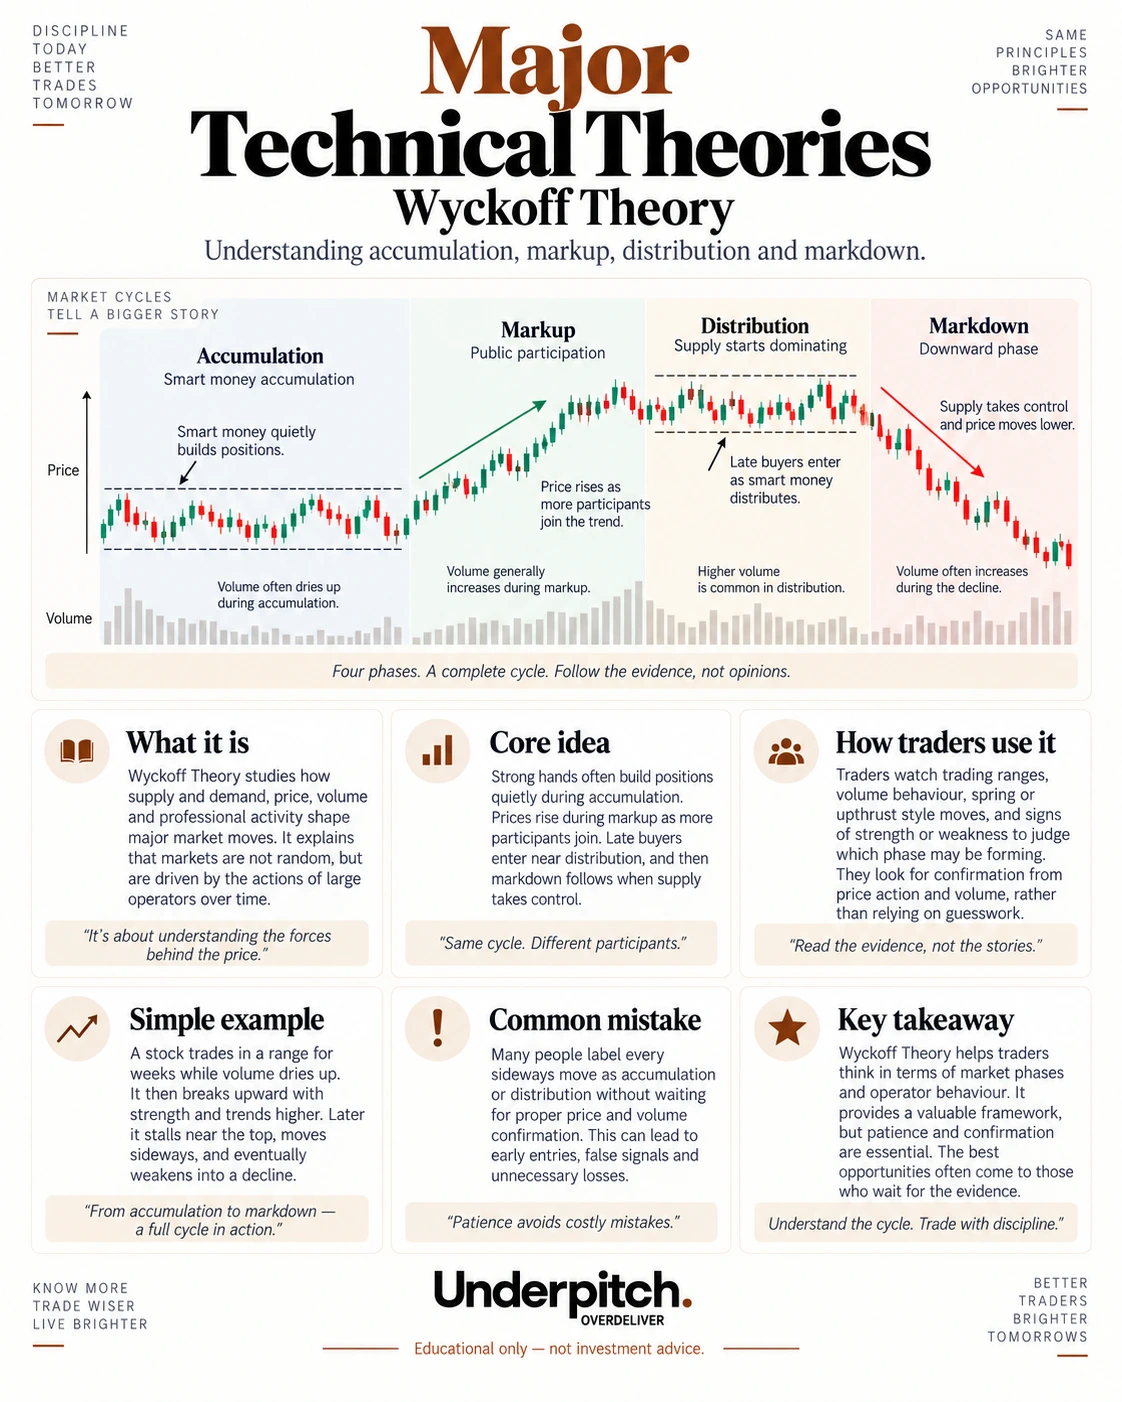
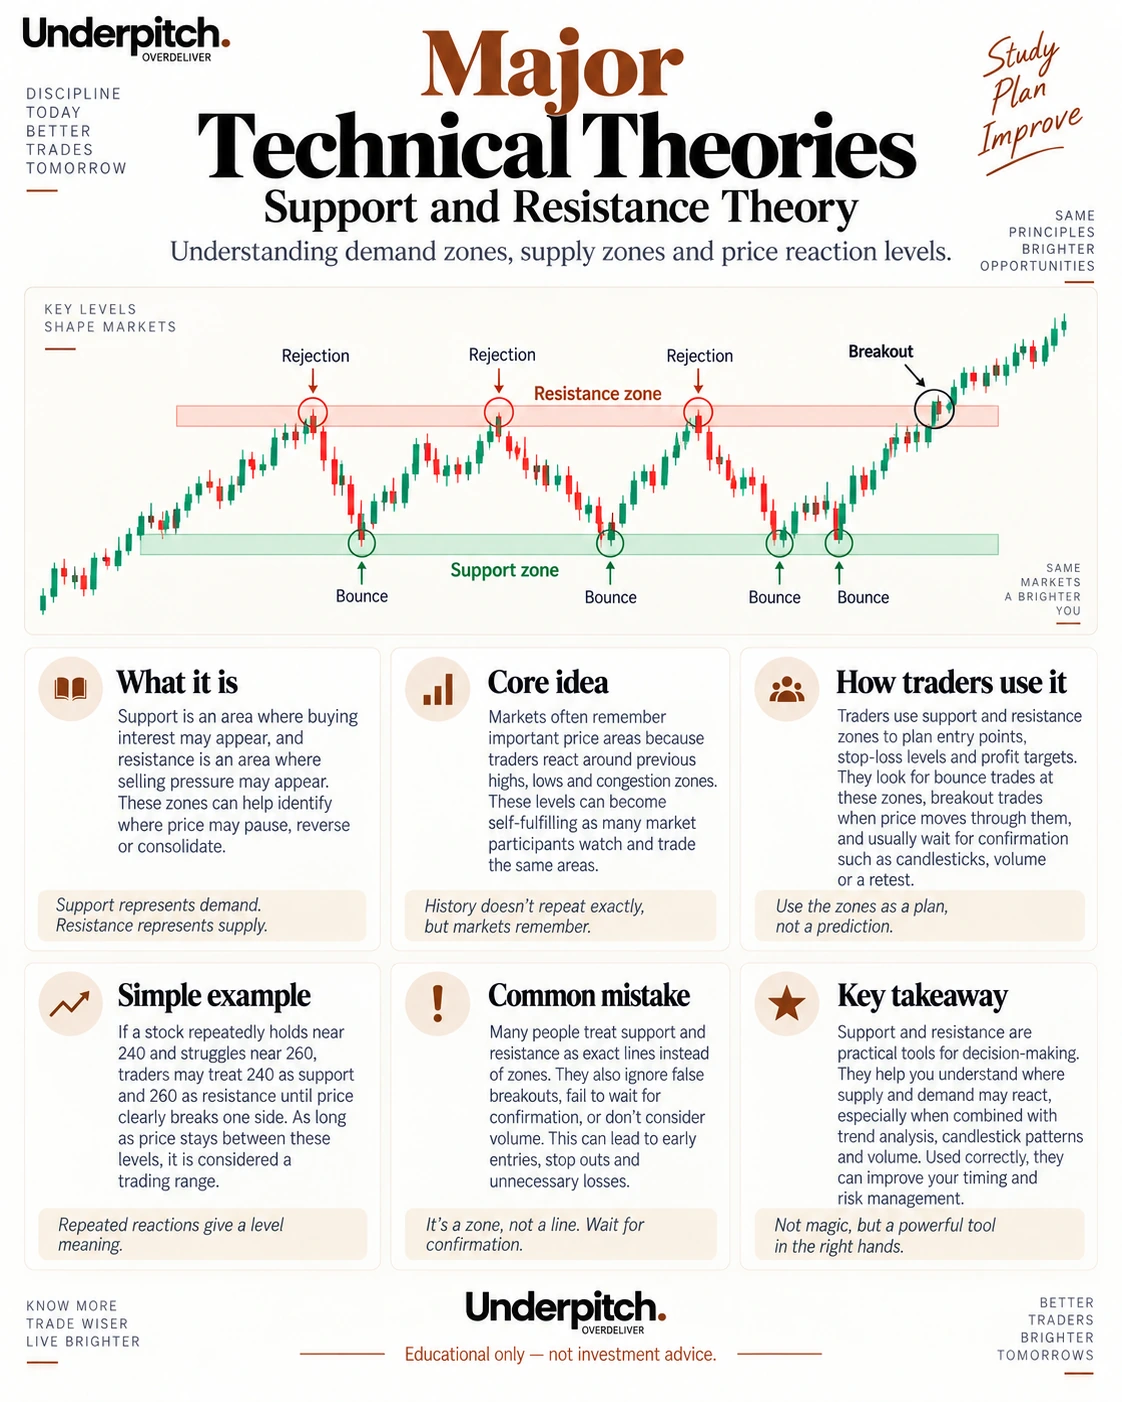
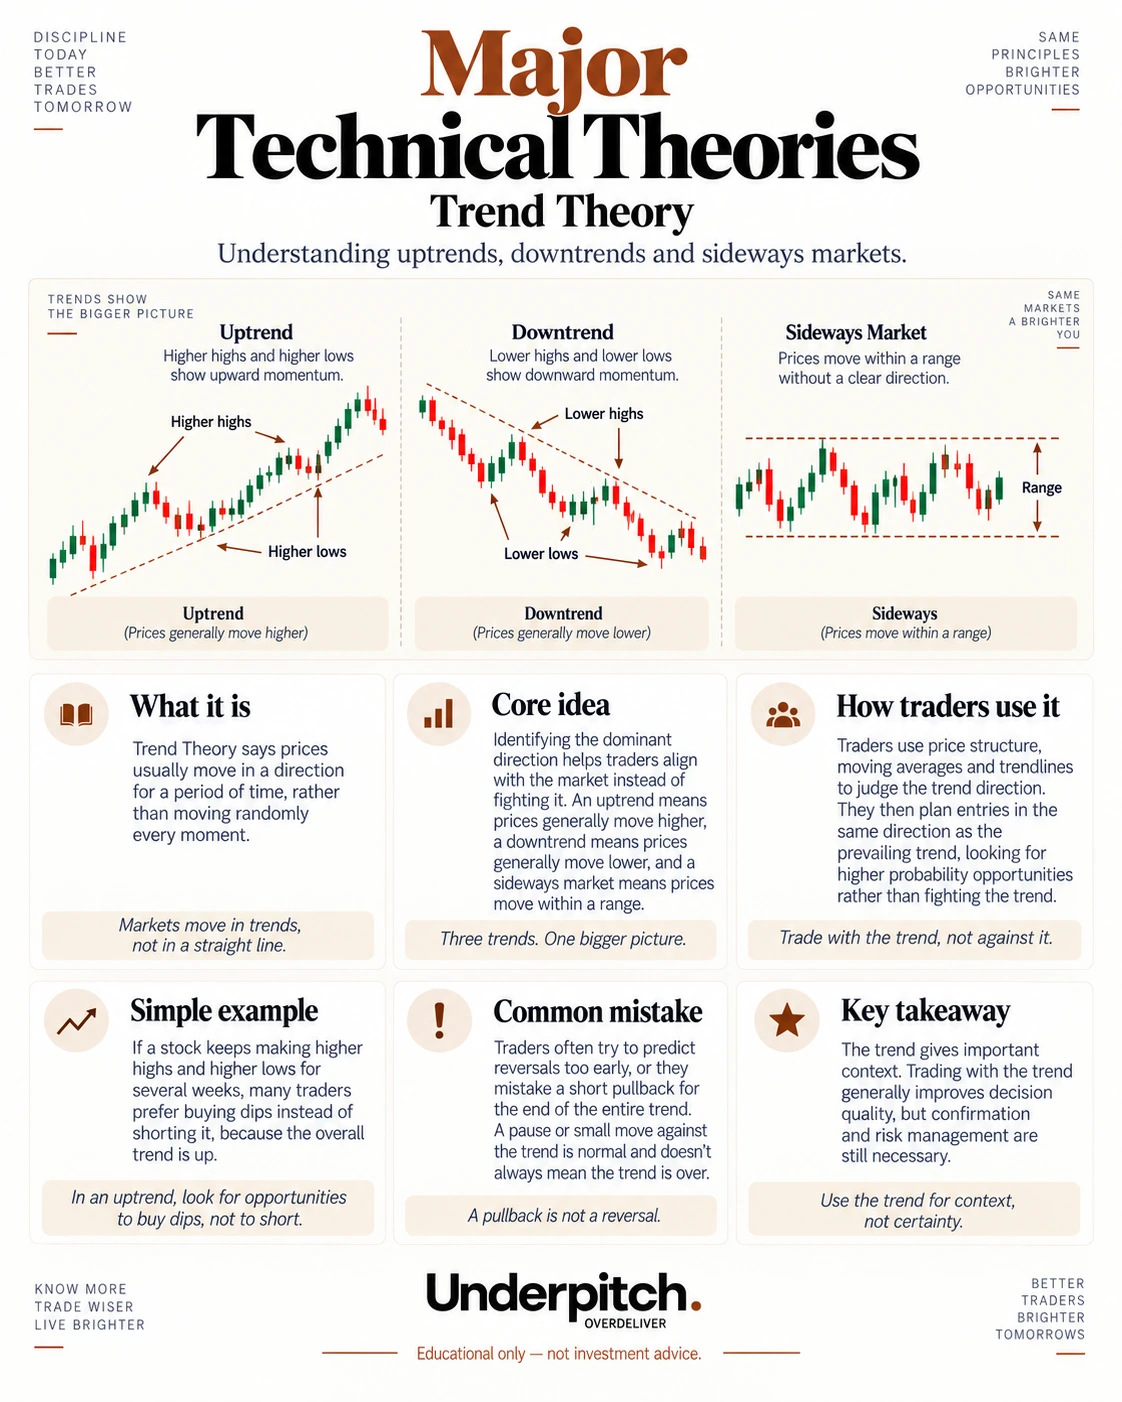
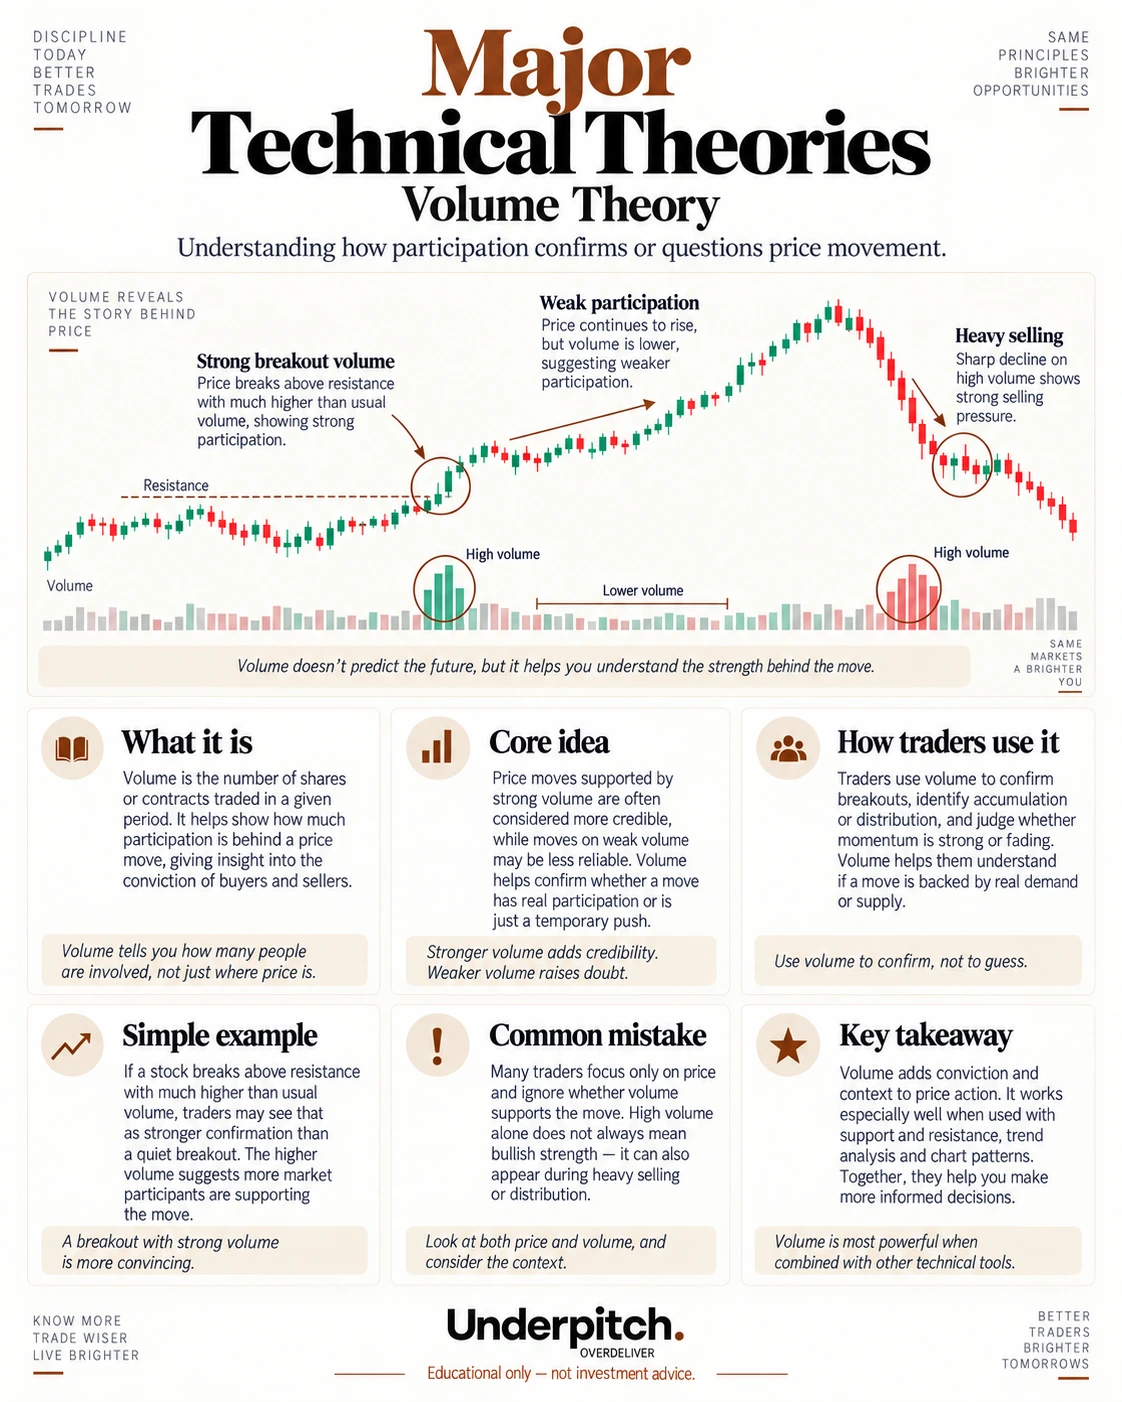
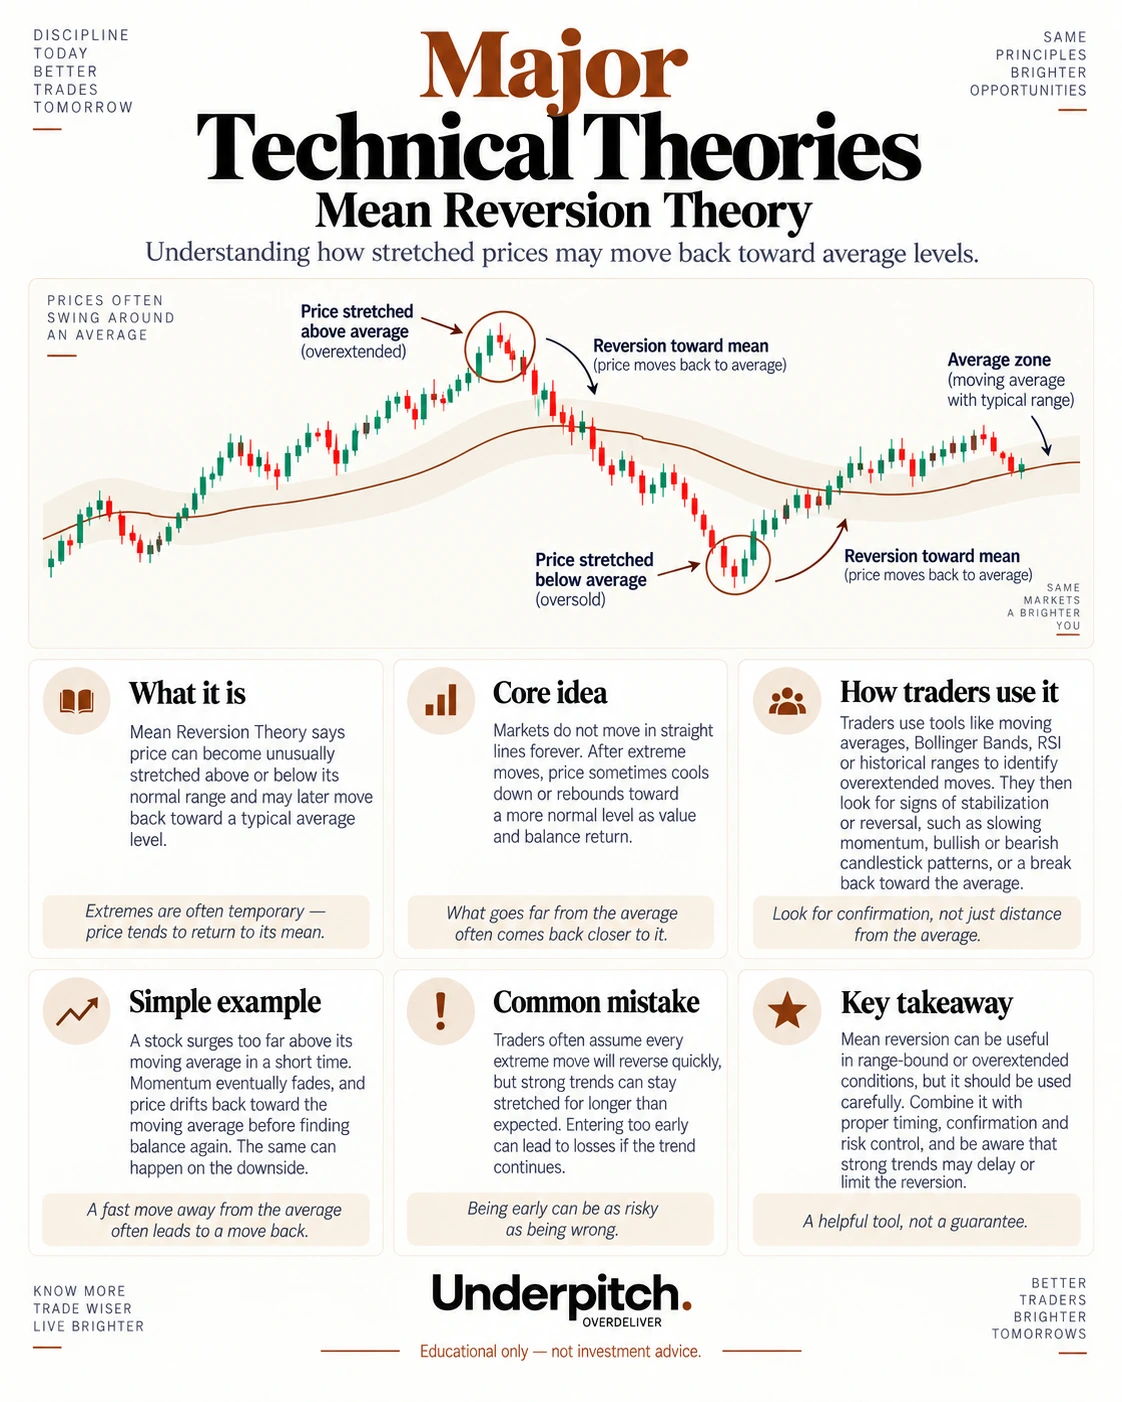
Major technical theories
Theories are ordered exactly as taught in the technical-theories guide.
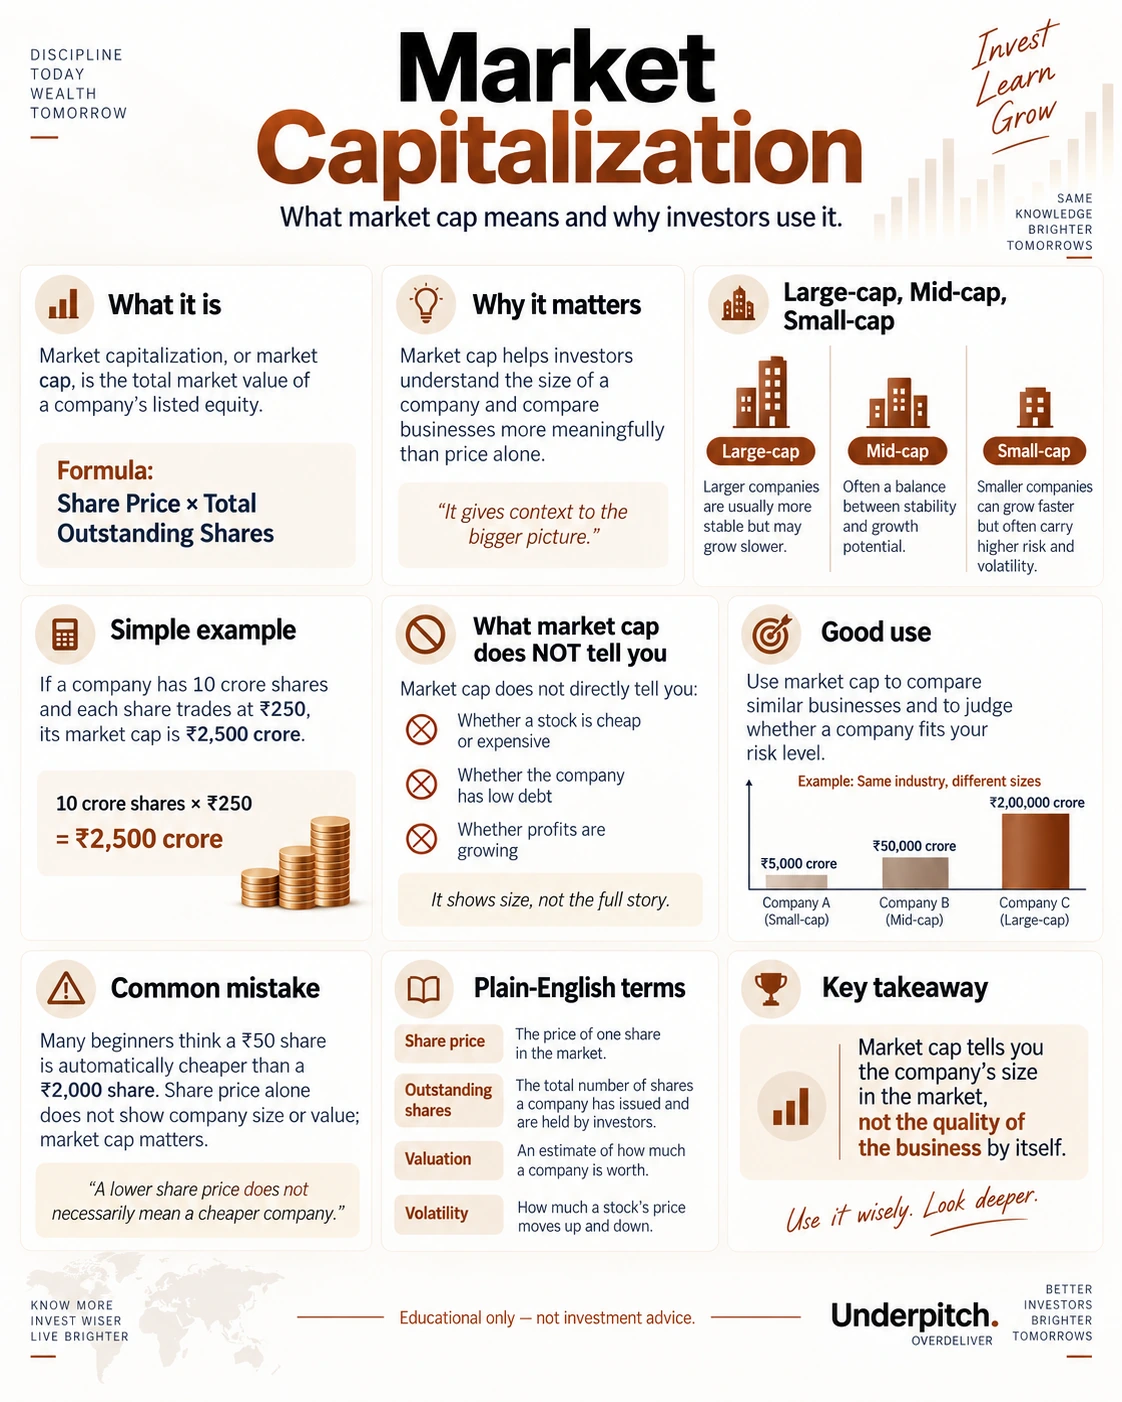
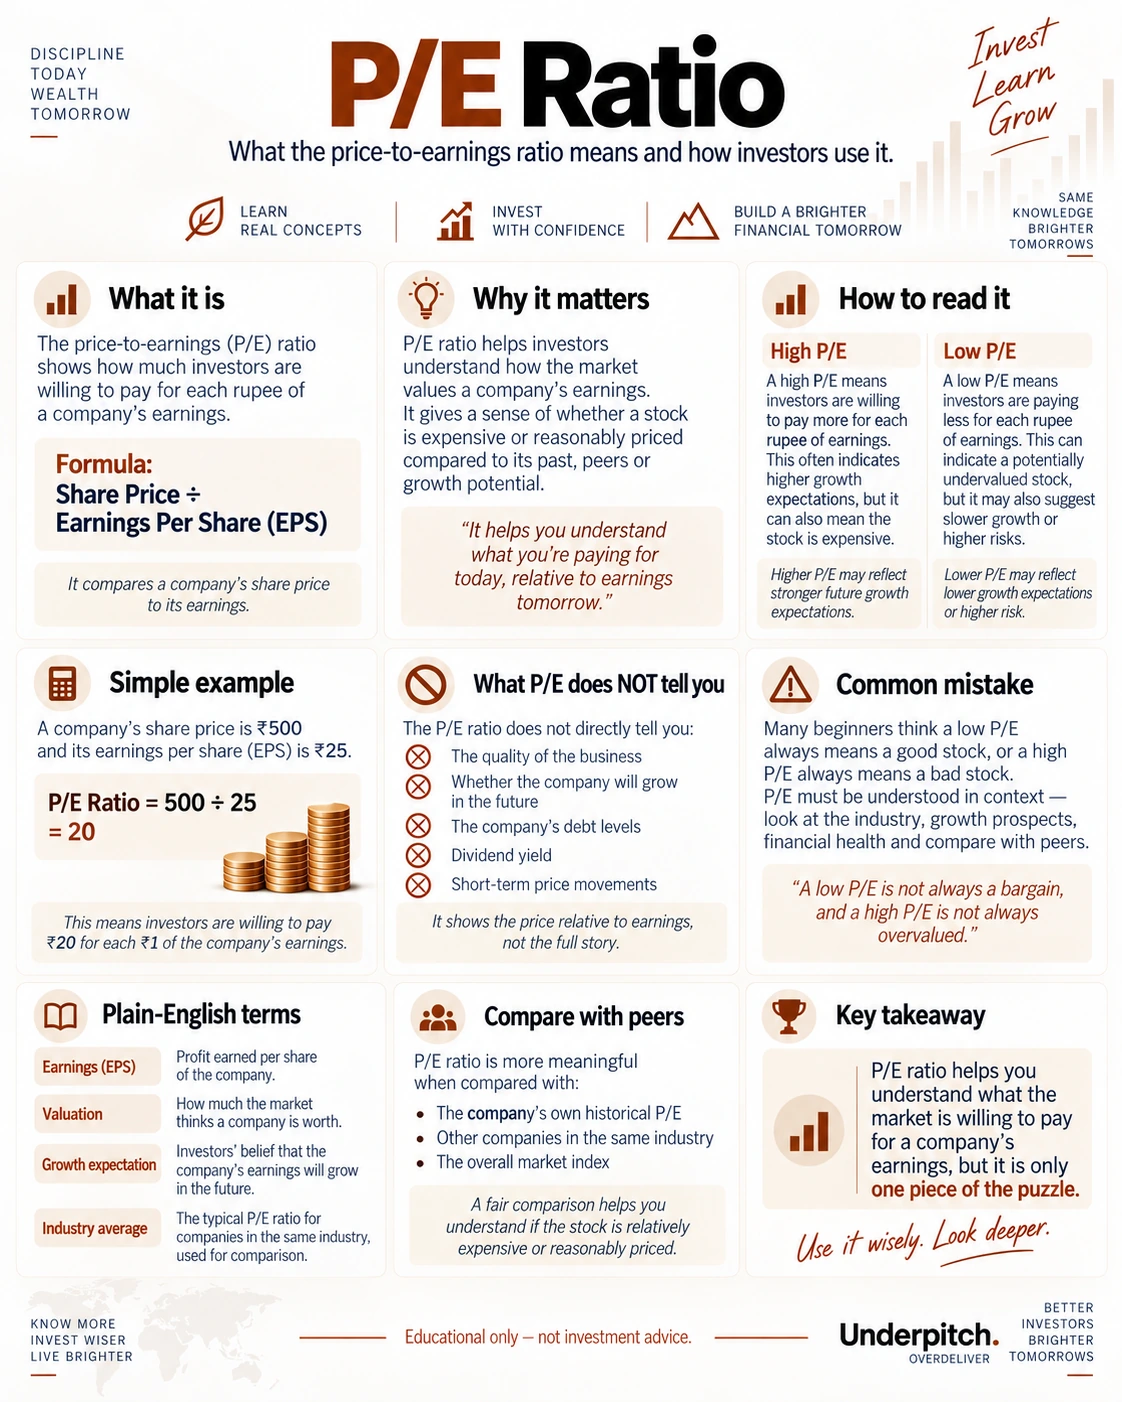
Key market terms
Each term has its own matching white-theme visual.
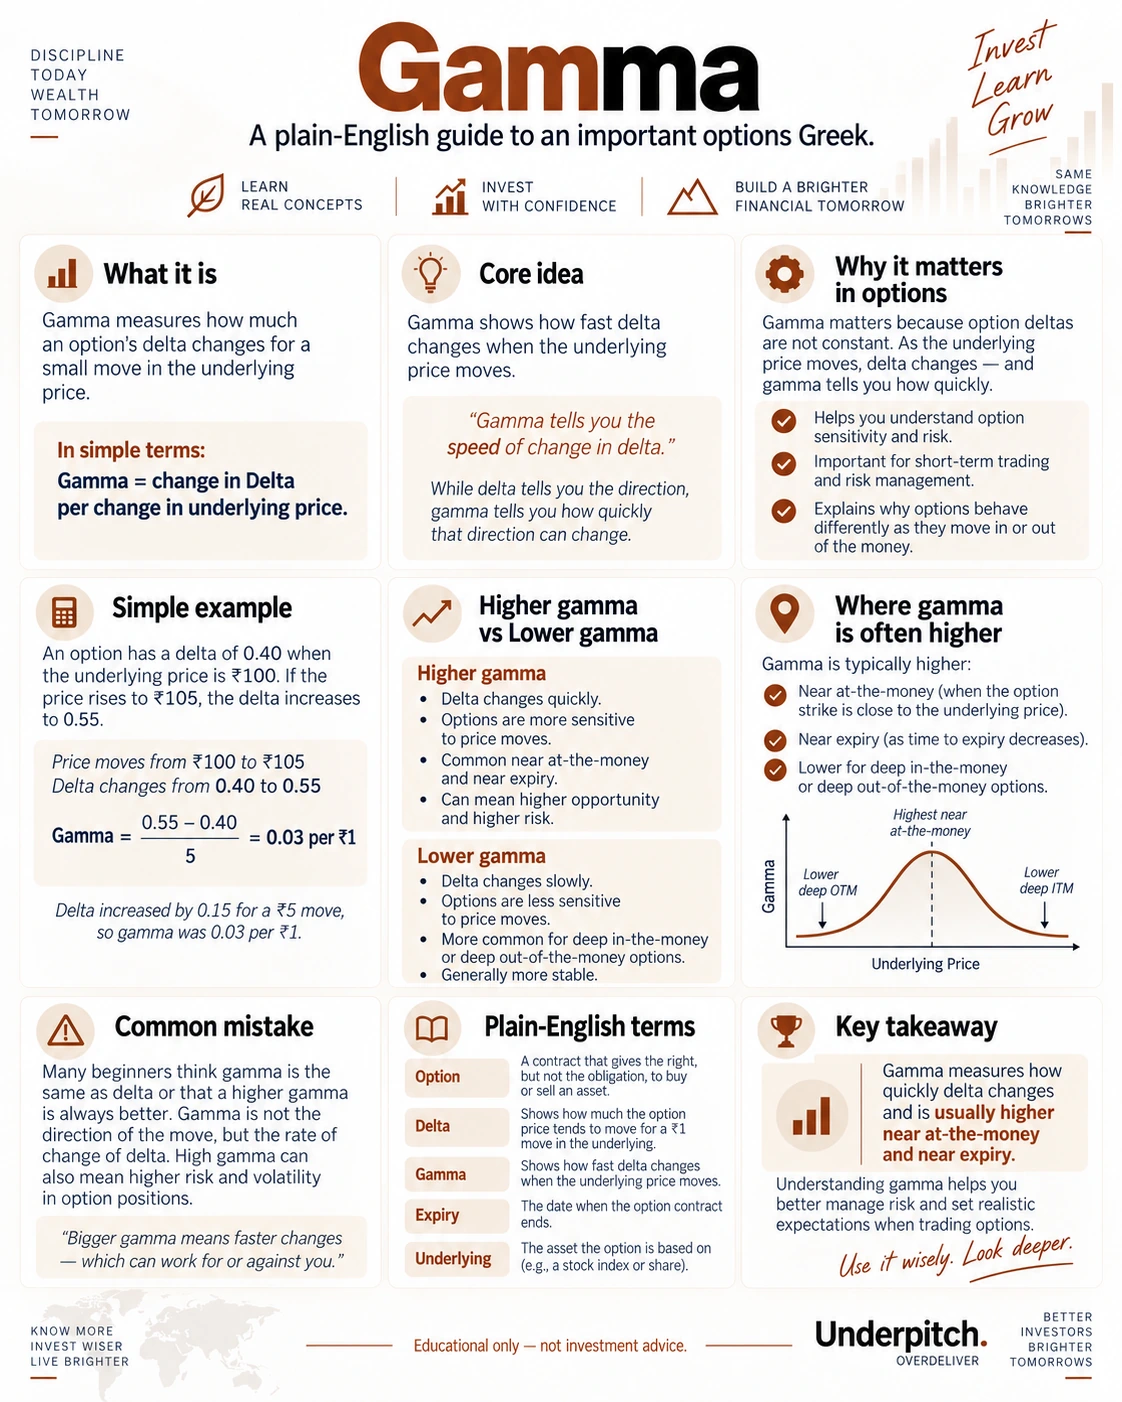
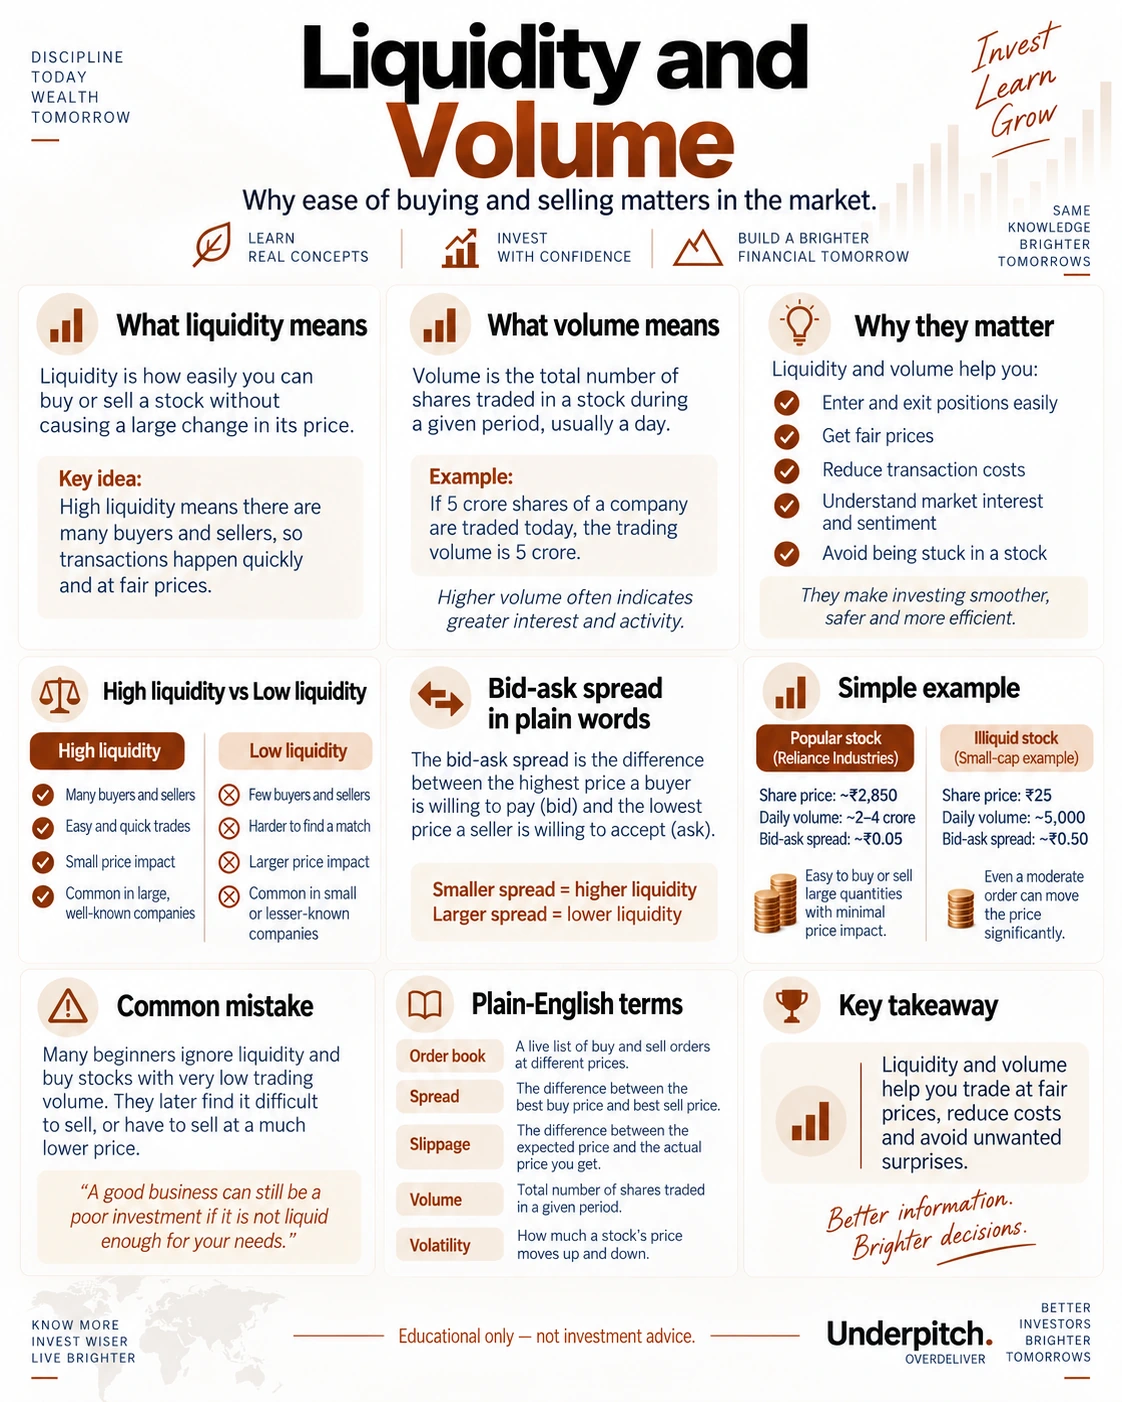
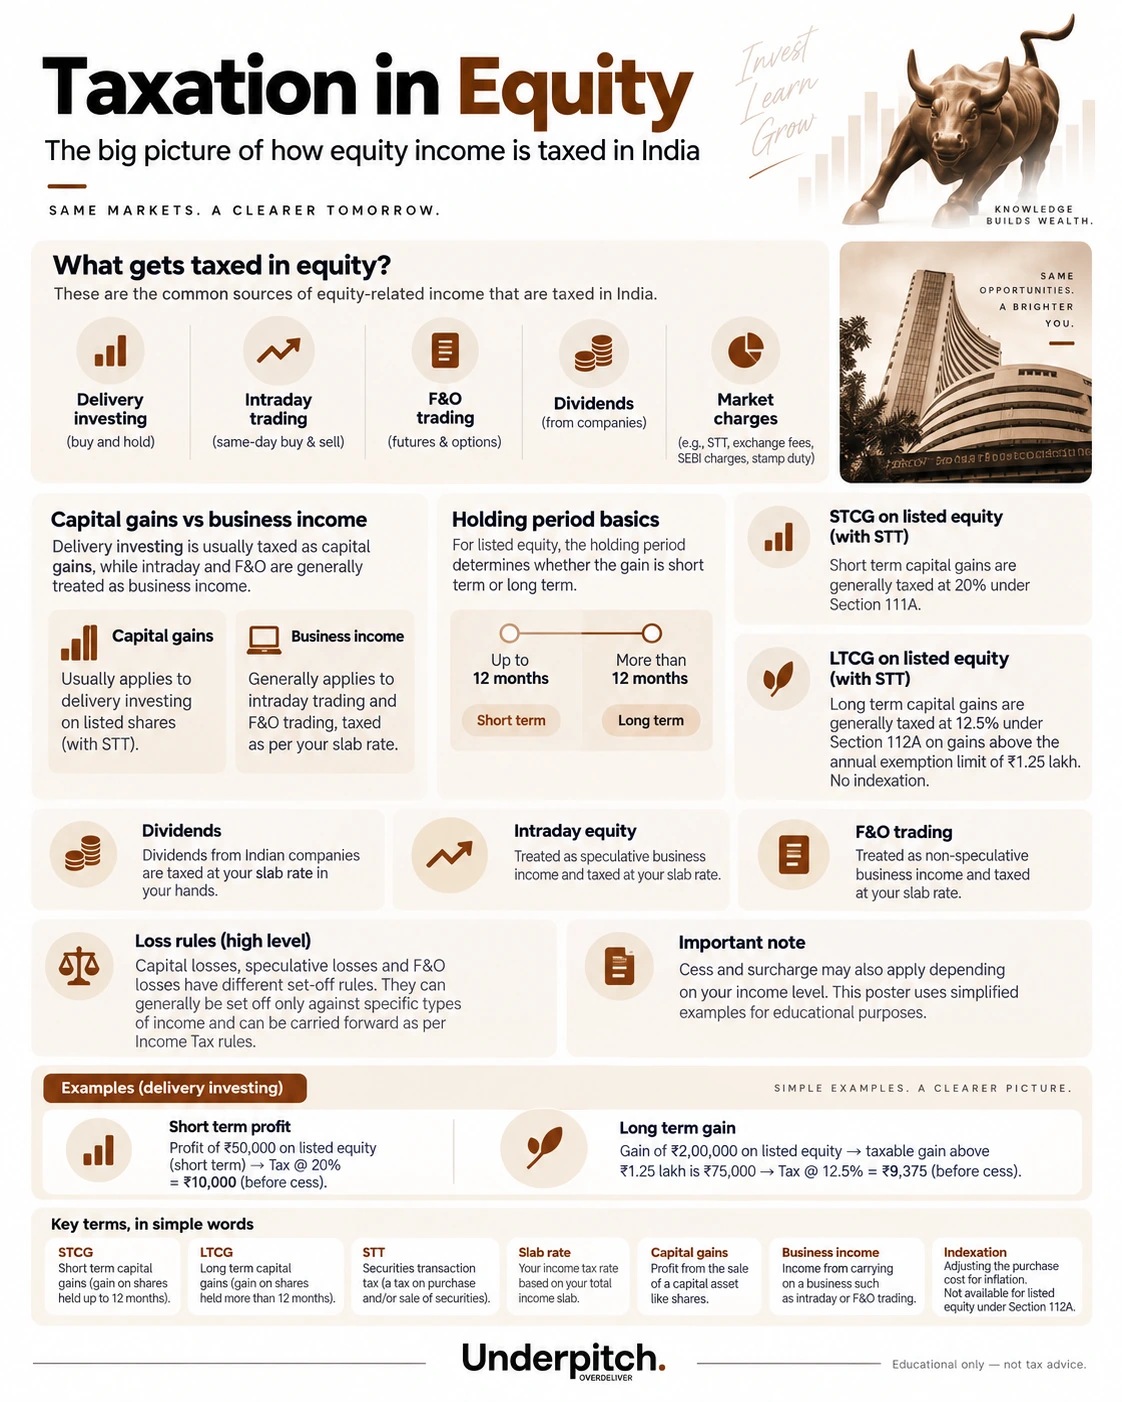
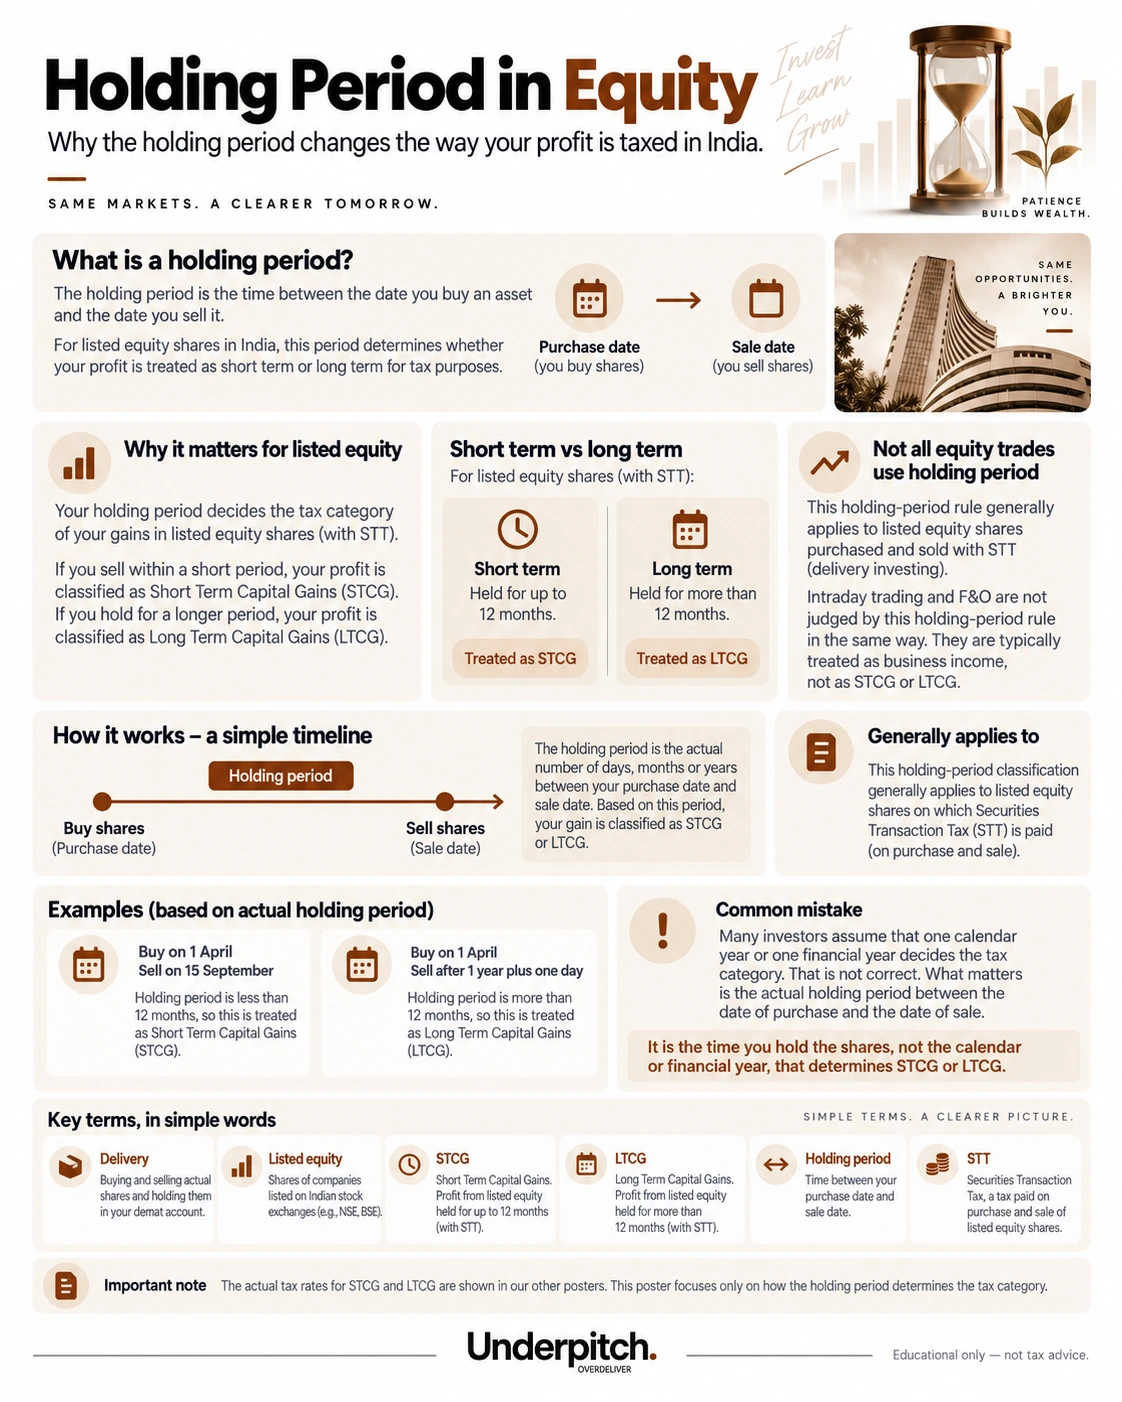
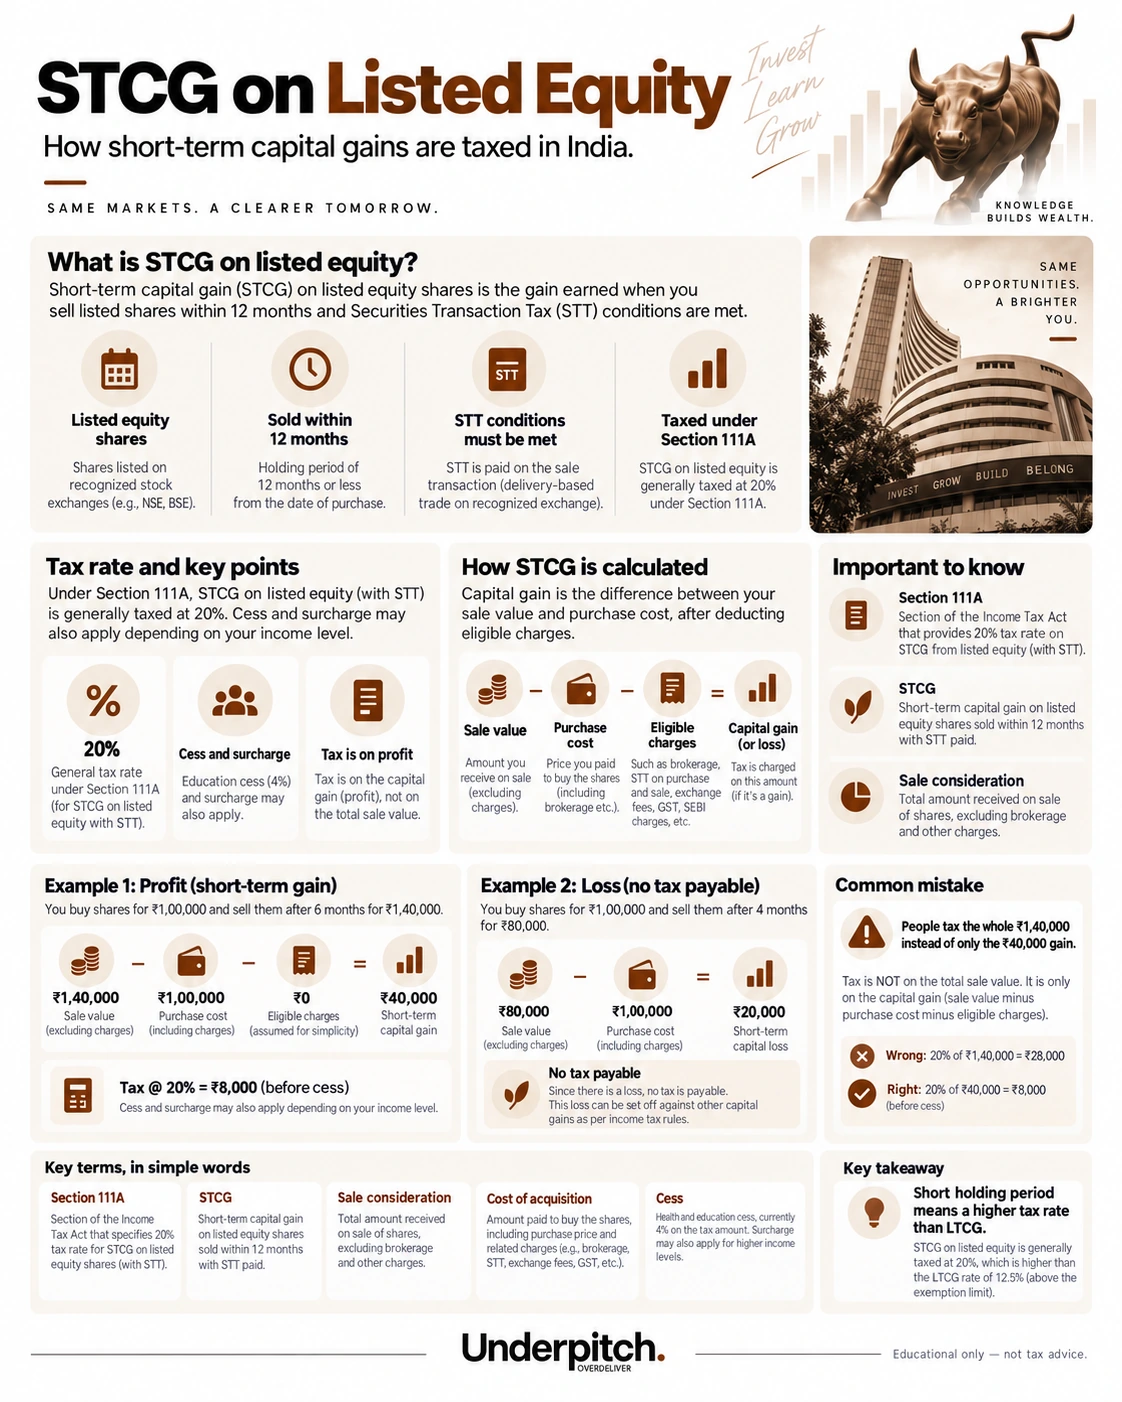
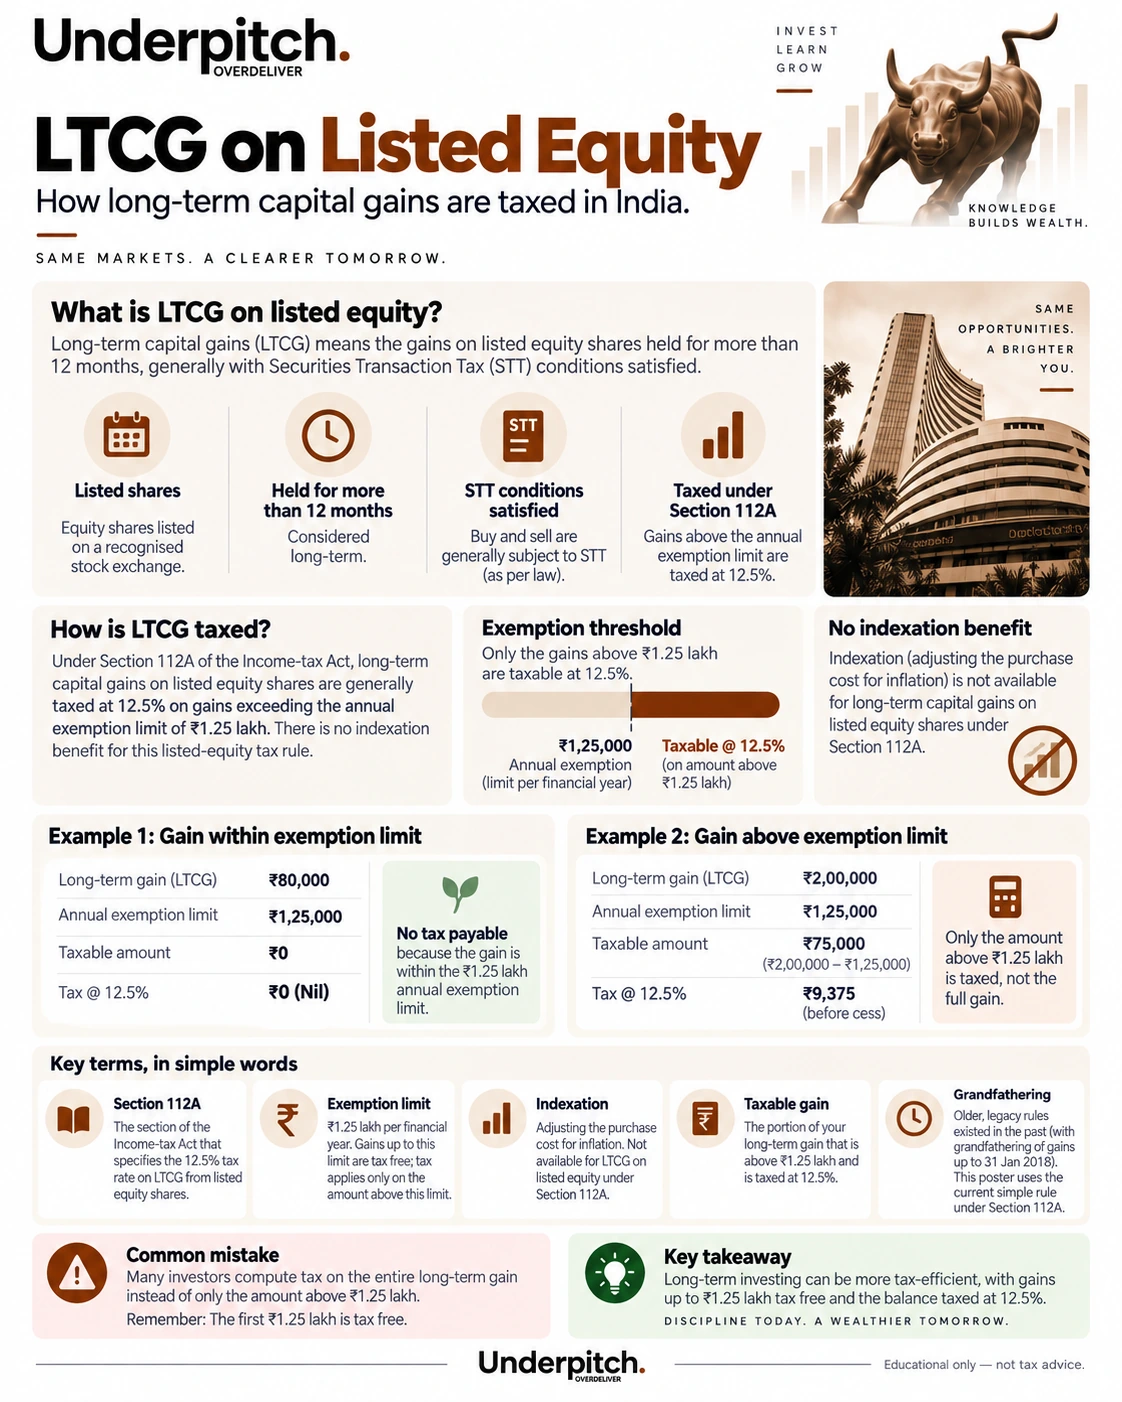
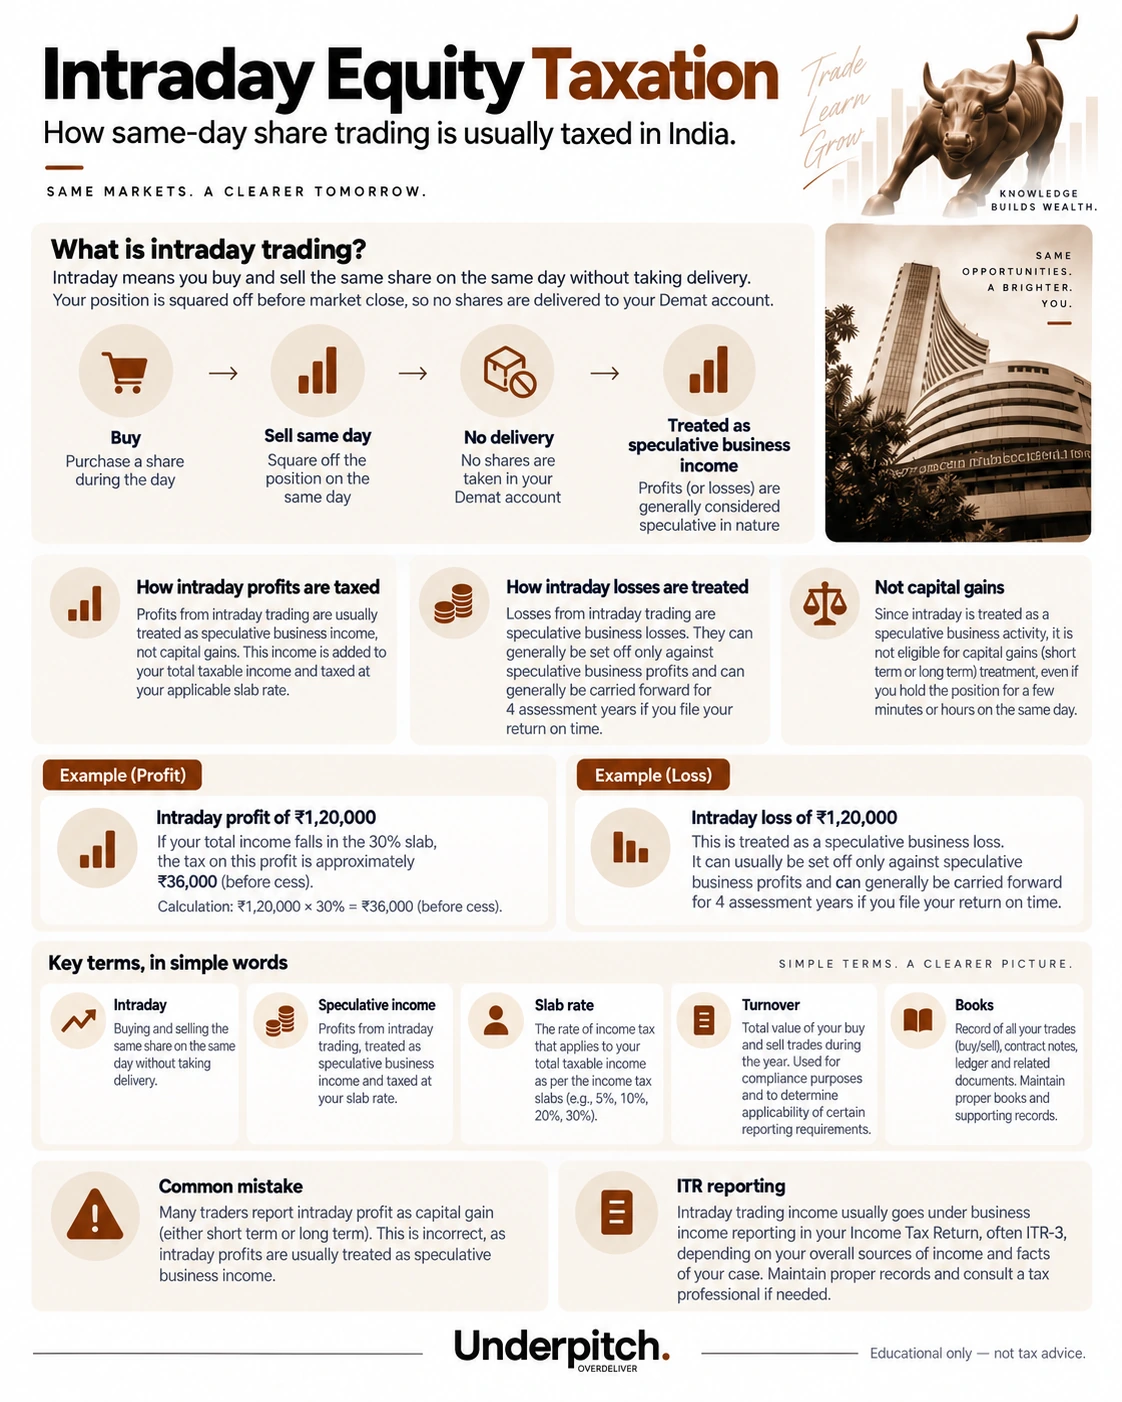
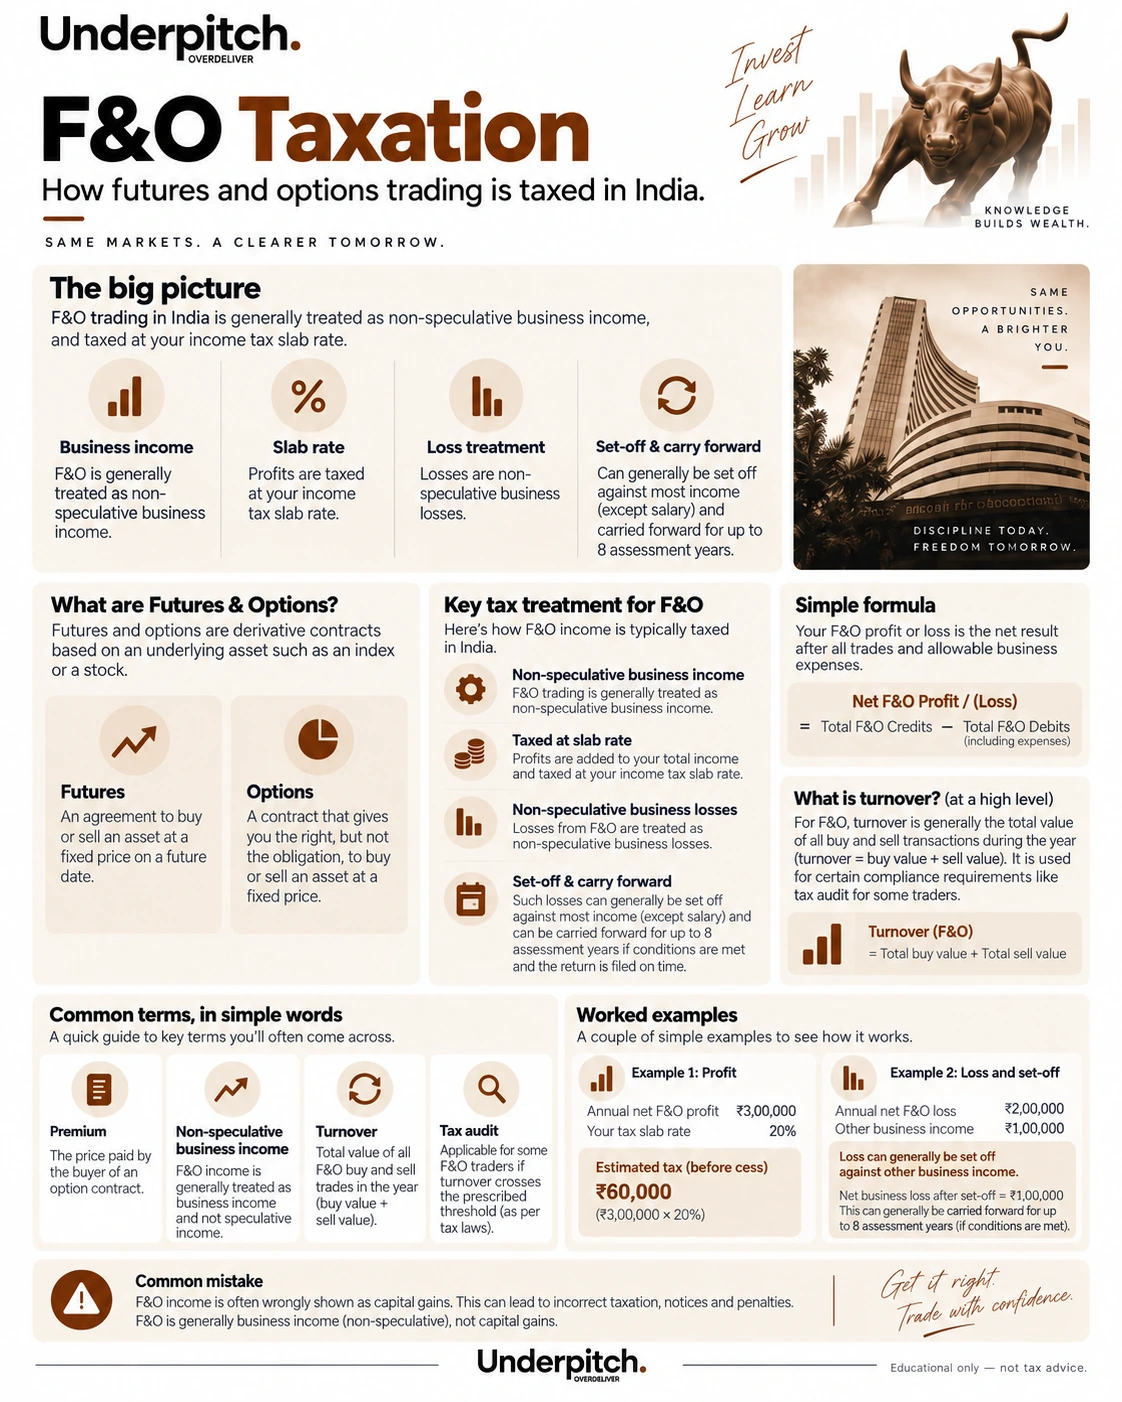
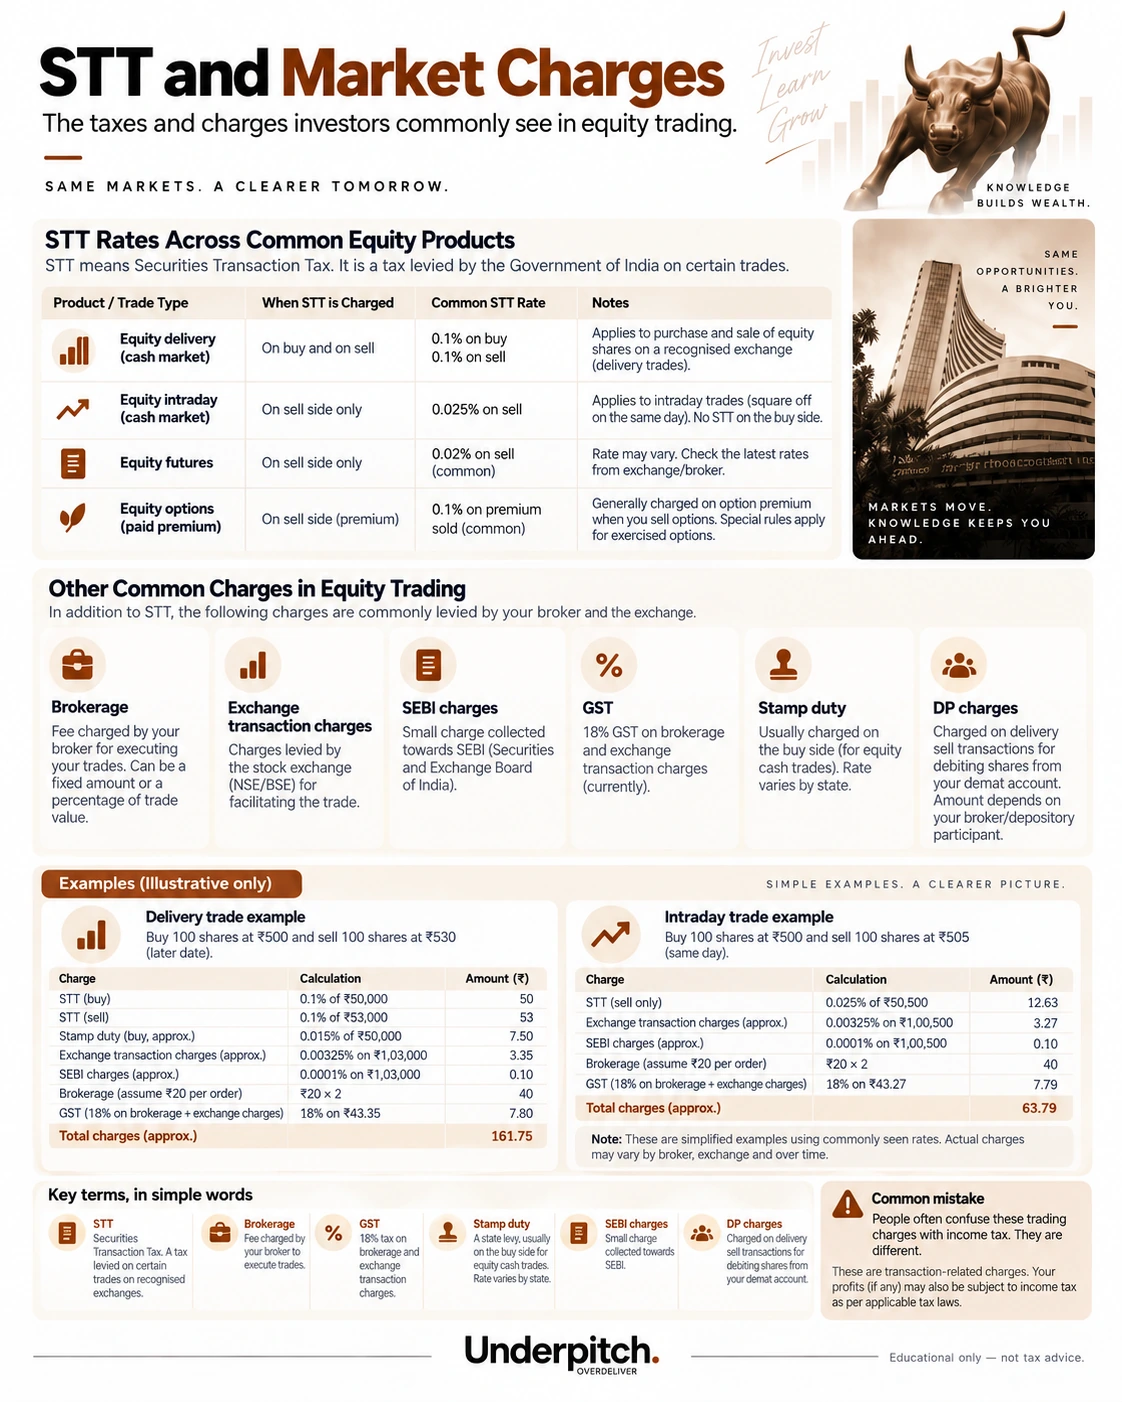
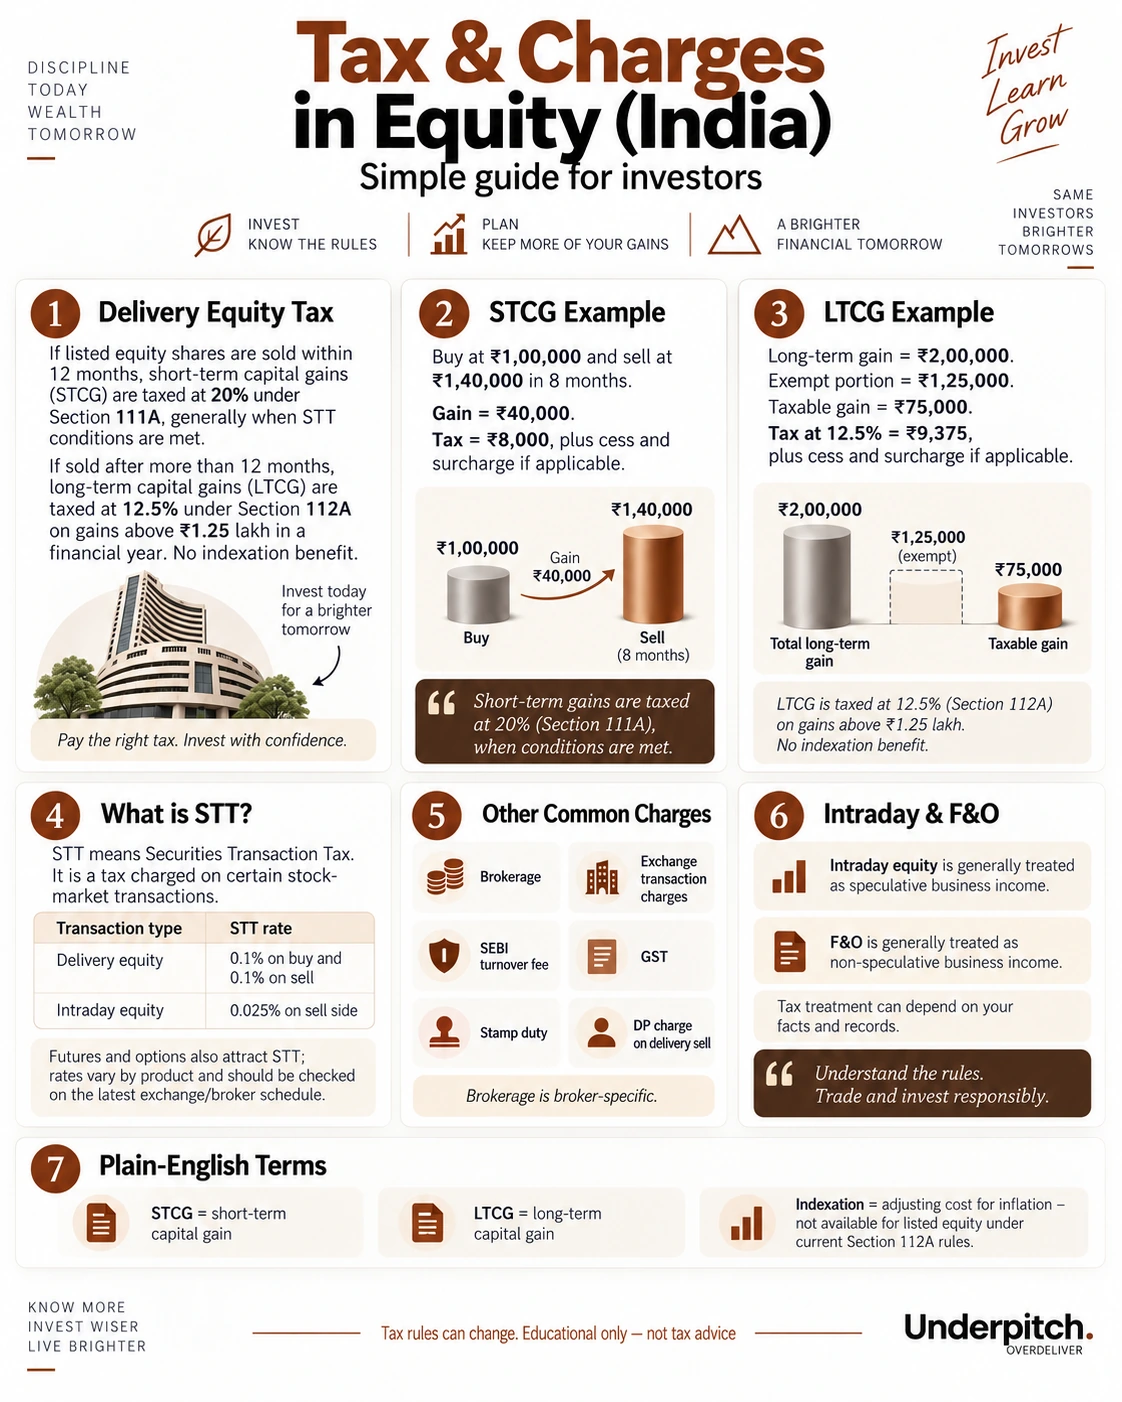
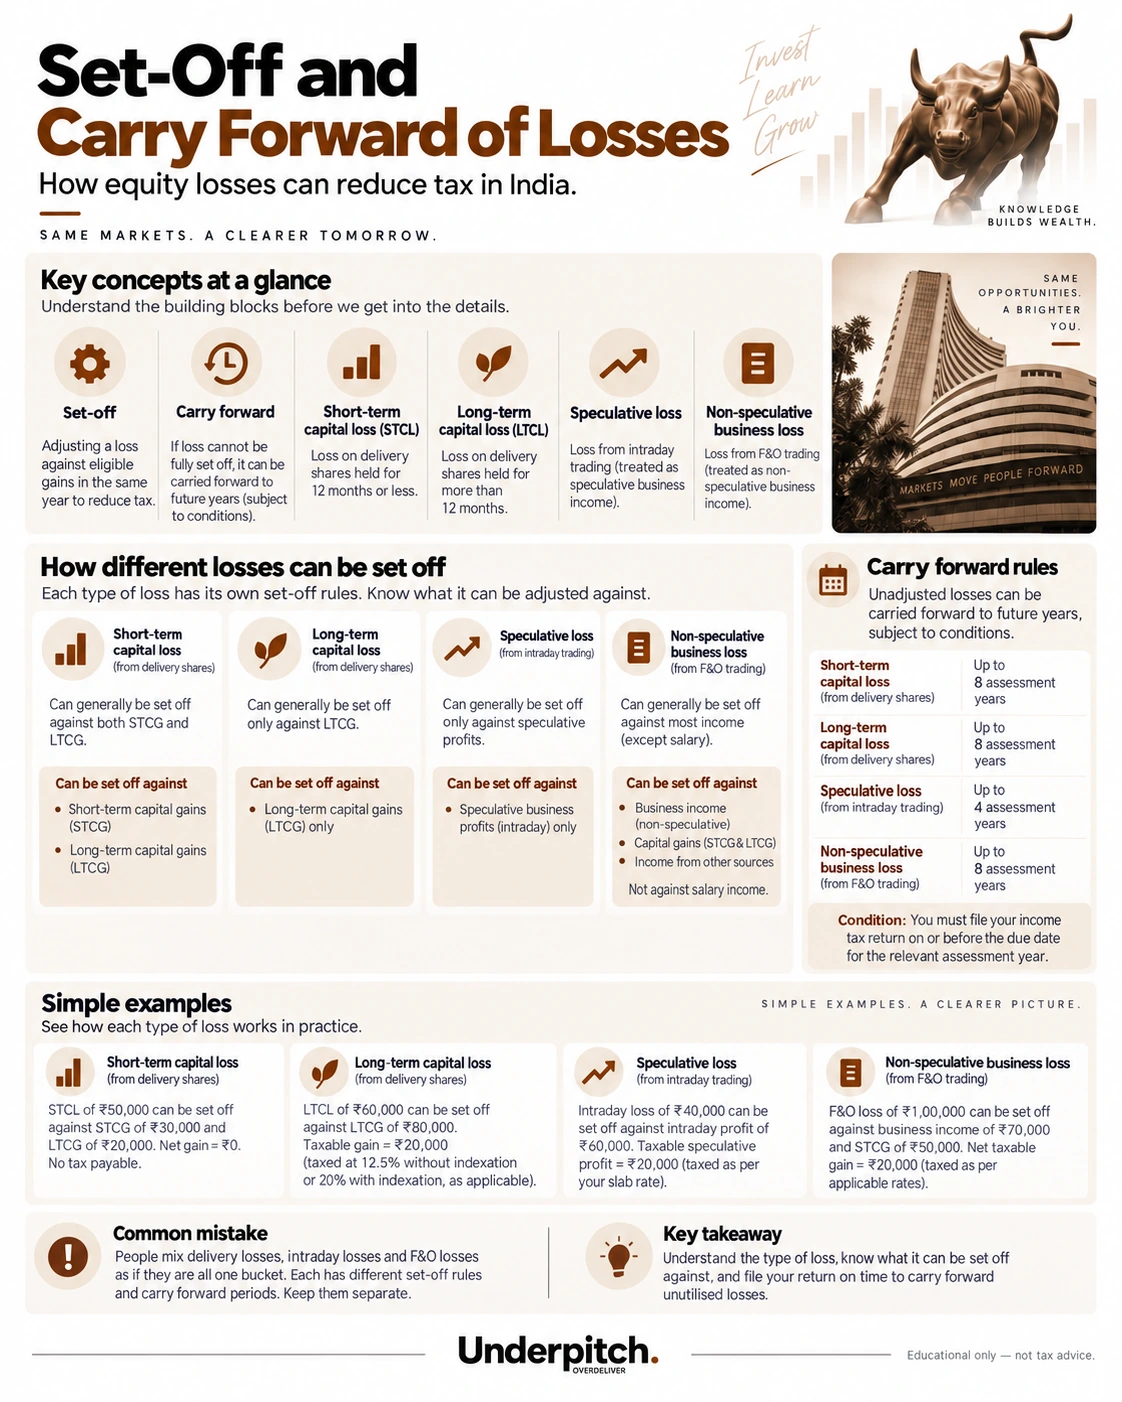
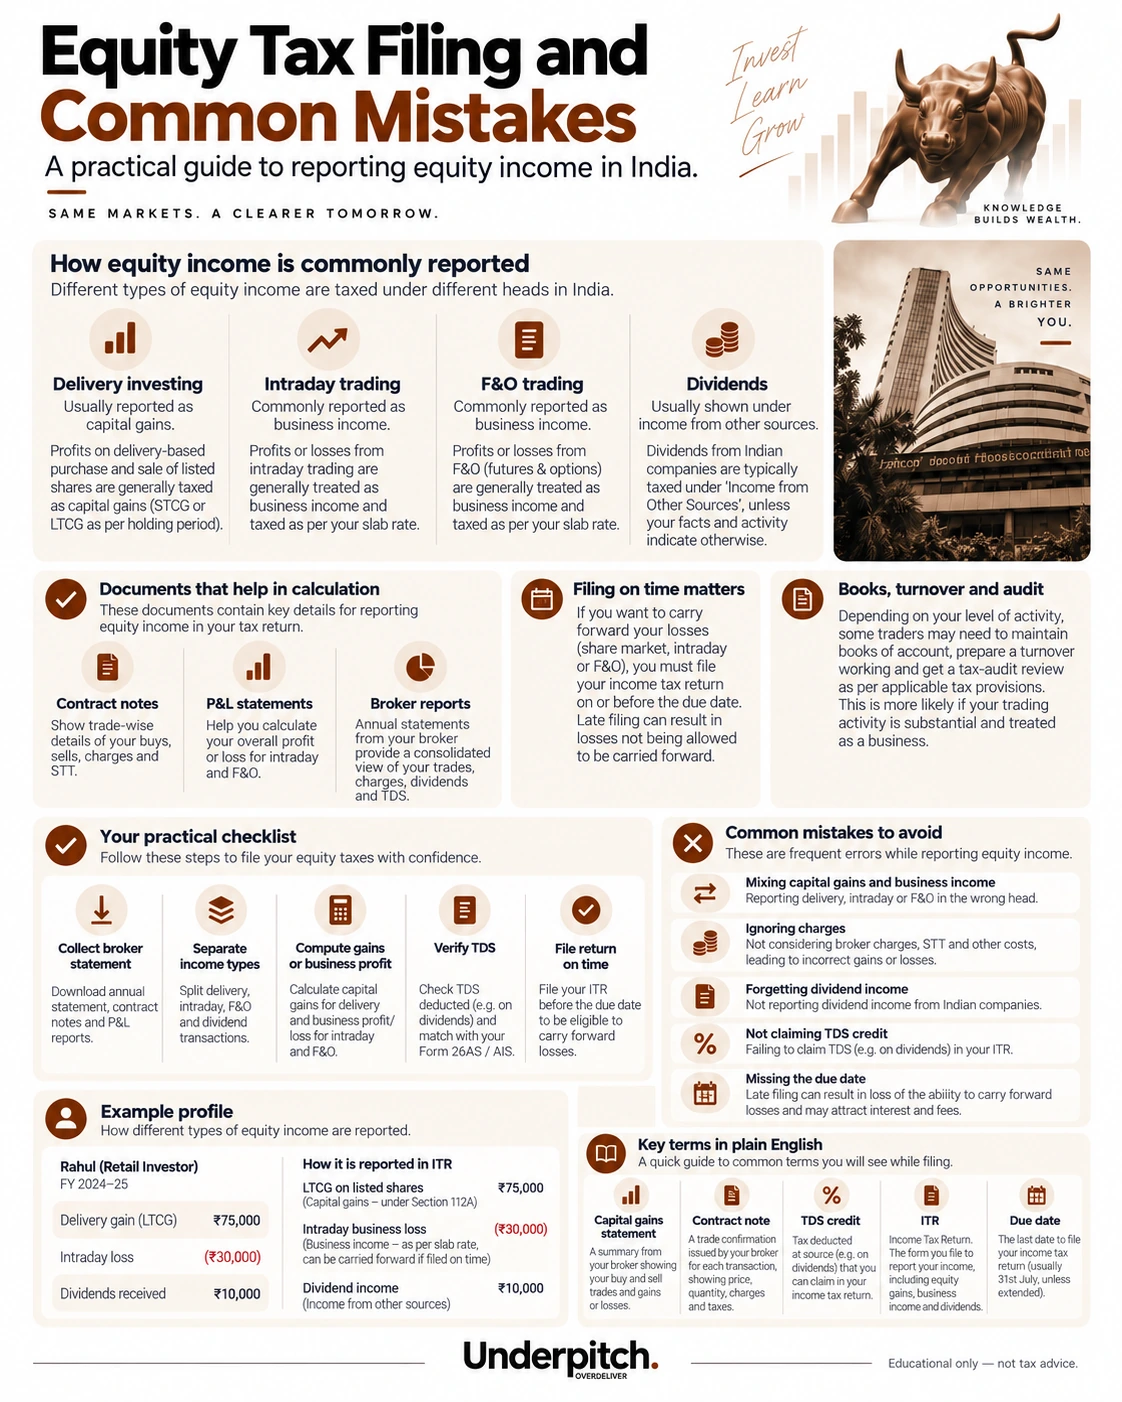
Taxation & charges
Tax visuals follow the same order as the tax guide. Current website text overrides any older figure inside an image.

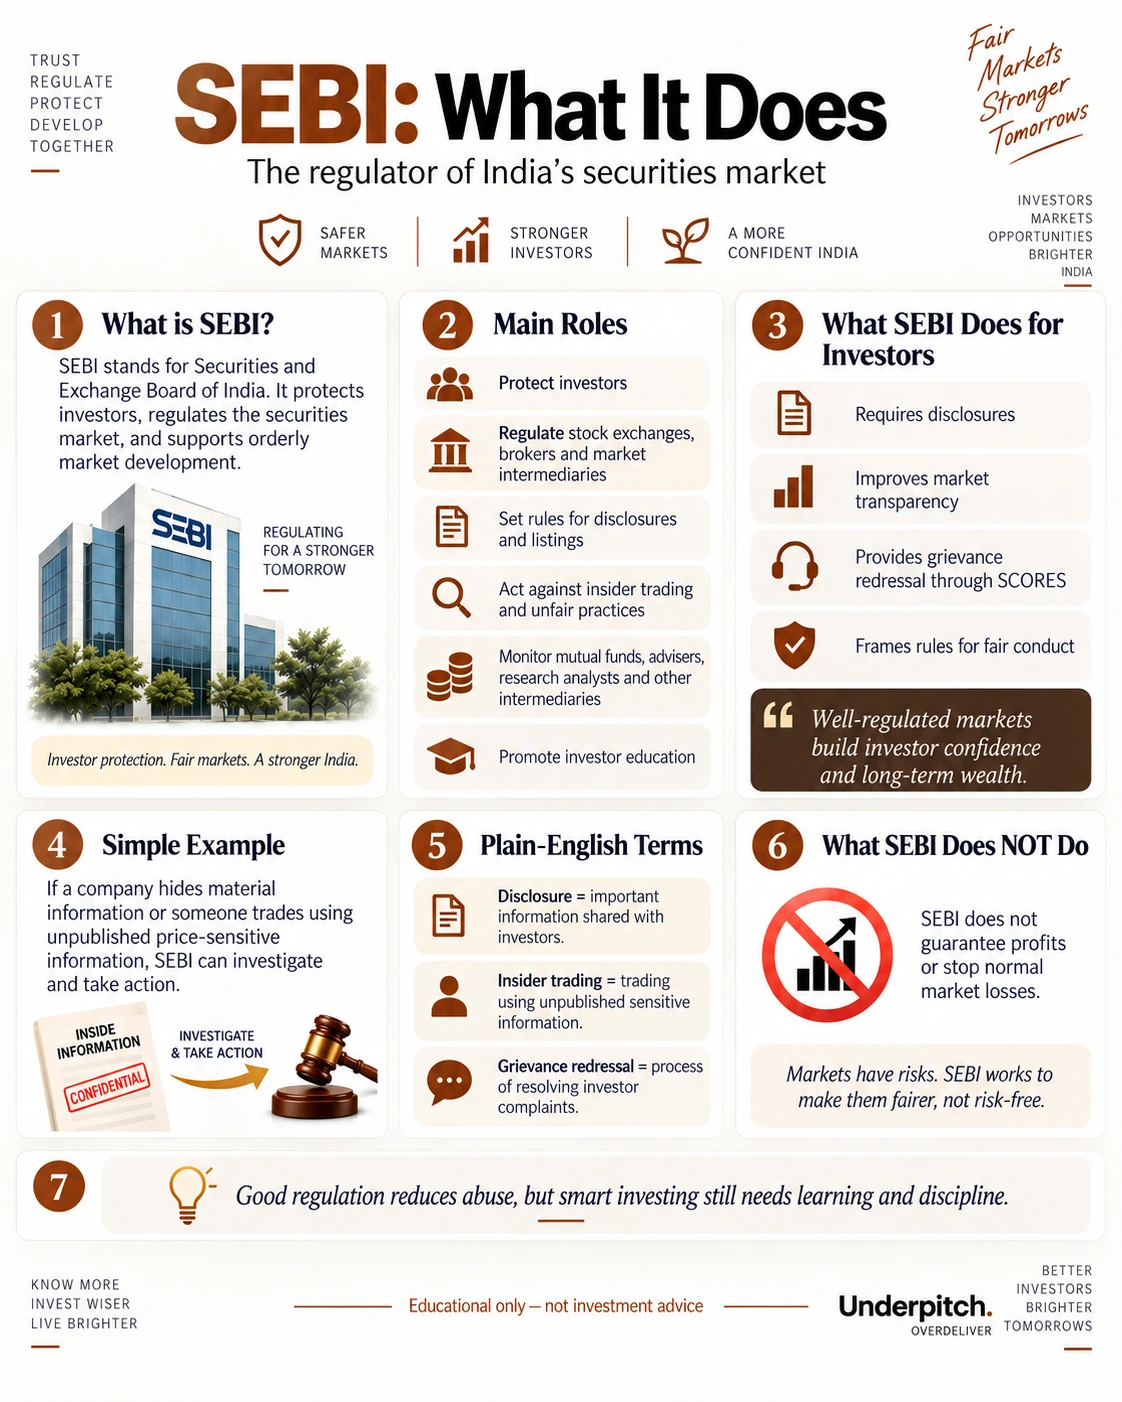
Role of SEBI
Only the matching neutral-theme SEBI visual is used.