
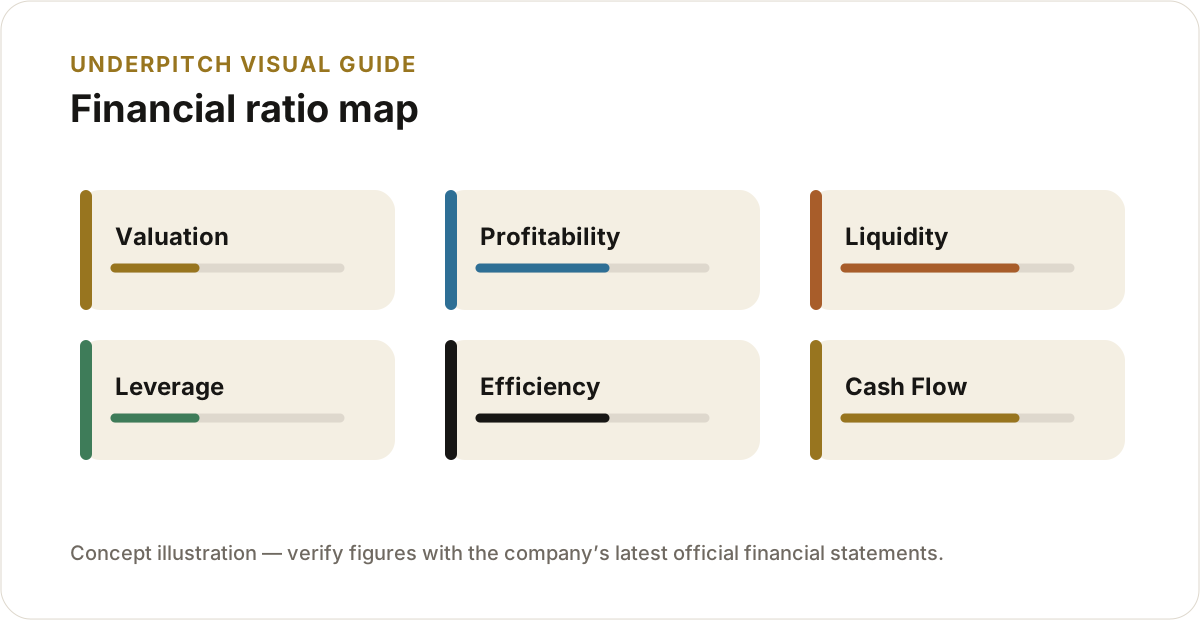
Financial ratios organise company analysis into valuation, profitability, liquidity, leverage, efficiency, cash-flow, growth and per-share questions. The formula is only the starting point: definitions, industry economics, accounting choices, seasonality and data quality determine whether the result is meaningful.
Valuation
P/E, P/B, P/S, EV/EBITDA, EV/EBIT, PEG, dividend yield and free-cash-flow yield compare market value with financial outputs.
Profitability
Margins, ROE, ROCE and ROA measure profit relative to sales, equity, capital and assets.
Liquidity and leverage
Current, quick and cash ratios assess near-term coverage; debt and coverage ratios assess solvency.
Efficiency and cash flow
Turnover ratios and working-capital days explain how assets and cash are used.
Formulas
| Metric | Simplified formula |
|---|---|
| P/E | Price per Share ÷ EPS |
| P/B | Price per Share ÷ Book Value per Share |
| EV/EBITDA | Enterprise Value ÷ EBITDA |
| ROE | Net Profit ÷ Average Equity × 100 |
| ROCE | EBIT ÷ Average Capital Employed × 100 |
| Current ratio | Current Assets ÷ Current Liabilities |
| Debt-to-equity | Total Debt ÷ Equity |
| Interest coverage | EBIT ÷ Finance Cost |
| Inventory days | Average Inventory ÷ COGS × 365 |
| Receivable days | Average Receivables ÷ Revenue × 365 |
| Free cash flow | CFO − Capital Expenditure |
| CAGR | (Ending ÷ Beginning)^(1/Years) − 1 |
Use average balance-sheet values where appropriate and confirm definitions used by the company or data provider.
How to use this in company analysis
- Calculate at least three to five years of history.
- Compare the company with relevant peers using consistent definitions.
- Read notes to accounts and management commentary behind unusual movements.
- Reconcile profit, balance-sheet growth and operating cash flow.
- Do not make a buy or sell decision from one ratio.
Important limitations
- Accounting policies and exceptional items can reduce comparability.
- Sector economics determine what is normal or risky.
- Quarterly values may be seasonal and unaudited.
- Financial companies require sector-specific metrics.
Educational information only. It is not a personalised investment, tax, accounting or buy/sell recommendation. Verify figures from the company’s latest official filings.