
A profit and loss statement explains how revenue became profit or loss during a period. Analyse revenue quality, gross and operating margins, employee and other costs, depreciation, finance cost, exceptional items, tax and earnings per share, then reconcile profit with cash flow.
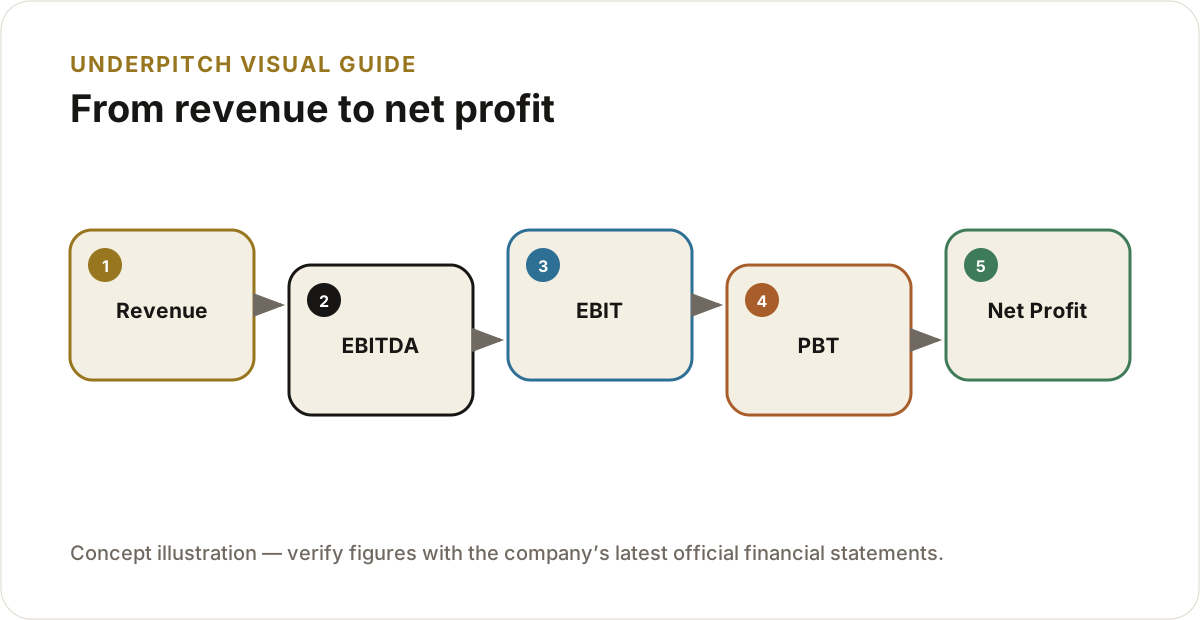
Revenue
Check whether growth comes from volume, price, acquisitions, currency or accounting changes. Compare reported growth with segment and geography disclosures.
Operating profit
EBITDA is revenue less operating expenses before depreciation, interest and tax. EBIT includes depreciation and better reflects asset consumption for capital-intensive businesses.
Finance cost and tax
Rising interest cost can reveal growing leverage. Compare the effective tax rate with statutory rates and investigate unusually low or volatile tax.
Exceptional items
Separate recurring operations from gains or losses on asset sales, impairments, settlements and restructuring. “Exceptional” does not always mean non-recurring.
EPS quality
EPS can rise because profit improves, shares are bought back or dilution falls. Compare basic and diluted EPS and check whether cash flow supports earnings.
Formulas
| Metric | Simplified formula |
|---|---|
| EBITDA | Revenue − Operating Expenses excluding Depreciation and Amortisation |
| EBIT | EBITDA − Depreciation and Amortisation |
| Net profit | Profit Before Tax − Tax |
| EPS | Profit attributable to equity shareholders ÷ Weighted average shares |
Use average balance-sheet values where appropriate and confirm definitions used by the company or data provider.
How to use this in company analysis
- Calculate at least three to five years of history.
- Compare the company with relevant peers using consistent definitions.
- Read notes to accounts and management commentary behind unusual movements.
- Reconcile profit, balance-sheet growth and operating cash flow.
- Do not make a buy or sell decision from one ratio.
Important limitations
- Accounting policies and exceptional items can reduce comparability.
- Sector economics determine what is normal or risky.
- Quarterly values may be seasonal and unaudited.
- Financial companies require sector-specific metrics.
Educational information only. It is not a personalised investment, tax, accounting or buy/sell recommendation. Verify figures from the company’s latest official filings.