
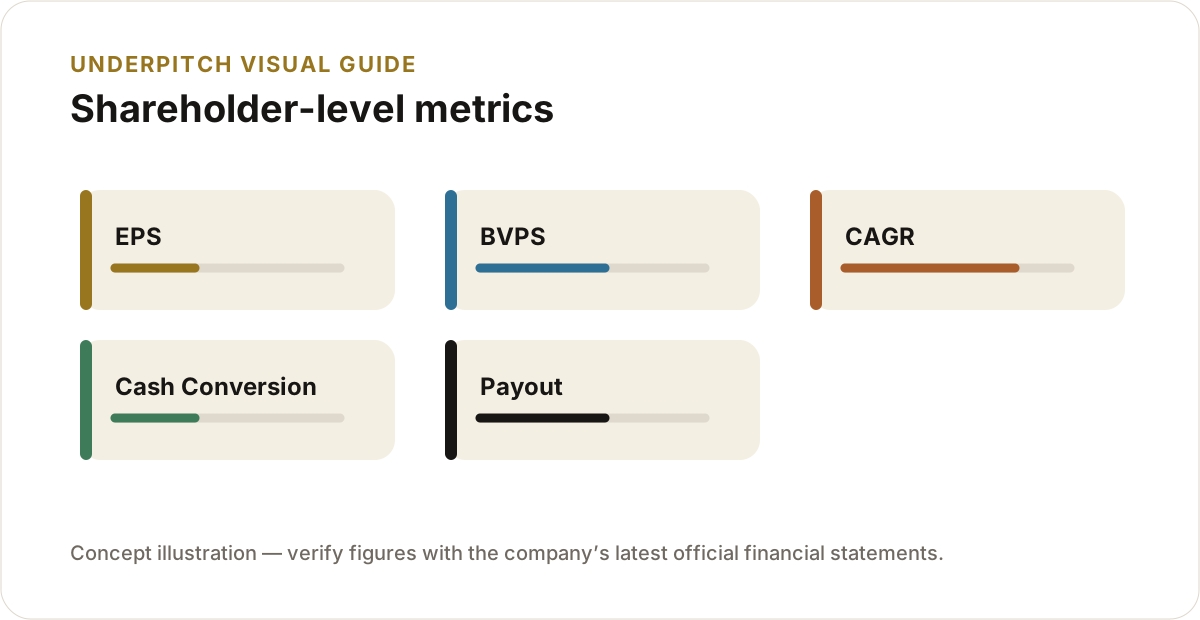
Per-share and growth ratios translate company totals into shareholder-level measures. Use diluted EPS, book value per share, revenue and profit CAGR, operating cash conversion, dividend payout and sustainable growth together. Growth that requires heavy dilution, debt or working capital may be less valuable.
EPS and dilution
Use weighted average shares and compare basic with diluted EPS. Options, warrants and convertible securities can reduce future per-share ownership.
CAGR
Summarises growth between two points but hides volatility and the path taken.
Cash conversion
CFO/net profit tests whether accounting earnings broadly convert into operating cash over time.
Payout and sustainable growth
Dividend payout shows distribution; retention and ROE help estimate growth that can be funded internally.
Formulas
| Metric | Simplified formula |
|---|---|
| Diluted EPS | Profit attributable to equity shareholders ÷ Diluted weighted average shares |
| Book value per share | Equity attributable to shareholders ÷ Outstanding shares |
| CAGR | (Ending Value ÷ Beginning Value)^(1 ÷ Years) − 1 |
| Cash conversion | Cash Flow from Operations ÷ Net Profit |
| Dividend payout | Dividend ÷ Net Profit × 100 |
| Sustainable growth | ROE × Retention Ratio |
Use average balance-sheet values where appropriate and confirm definitions used by the company or data provider.
How to use this in company analysis
- Calculate at least three to five years of history.
- Compare the company with relevant peers using consistent definitions.
- Read notes to accounts and management commentary behind unusual movements.
- Reconcile profit, balance-sheet growth and operating cash flow.
- Do not make a buy or sell decision from one ratio.
Important limitations
- Accounting policies and exceptional items can reduce comparability.
- Sector economics determine what is normal or risky.
- Quarterly values may be seasonal and unaudited.
- Financial companies require sector-specific metrics.
Educational information only. It is not a personalised investment, tax, accounting or buy/sell recommendation. Verify figures from the company’s latest official filings.